by Don Vialoux, EquityClock.com
Interview for Investor’s Digest
Don Vialoux was asked for a “Top Pick” by Investor’s Digest. Selection was Metal and Mining iShares (Symbol: XME Price: US$44.50). Comments are published today.
Technical Notes released yesterday at
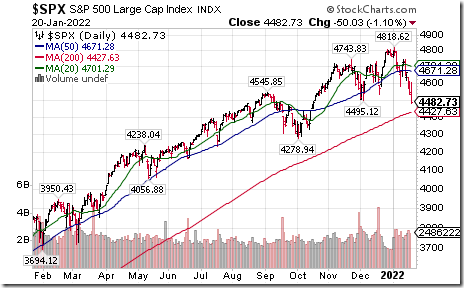
S&P 500 Index moved below intermediate support at 4,495.12 and S&P 500 iShares $SPY moved below intermediate support at $447.35.
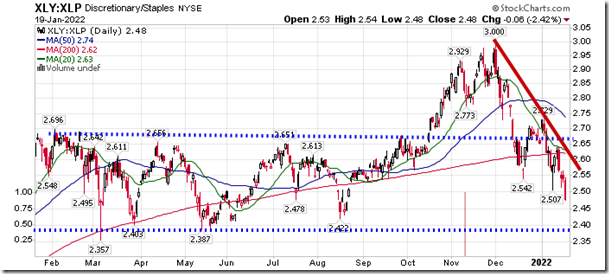
Until the trends of risk aversion abate, caution in portfolio positioning remains appropriate. equityclock.com/2022/01/19/… $XLY $XLP $IWM $XLU $XLV $GLD
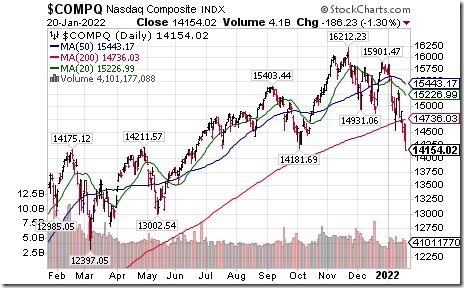
NASDAQ Composite Index $COMPQ moved below intermediate support at 14,181.69 extending an intermediate downtrend.
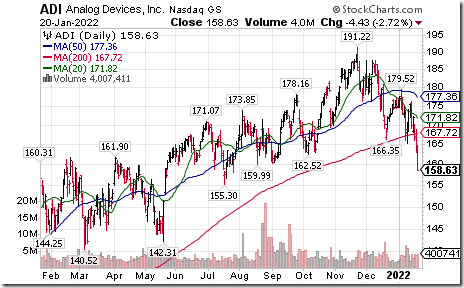
More weakness in the U.S. Technology sector! Analog Devices $ADI a NASDAQ 100 stock moved below $162.52 extending an intermediate downtrend.
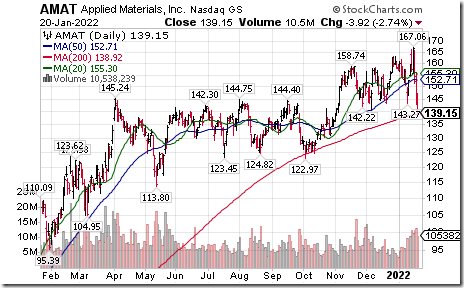
Another technology stock breakdown! Applied Materials $AMAT a NASDAQ 100 stock moved below intermediate support at $142.22
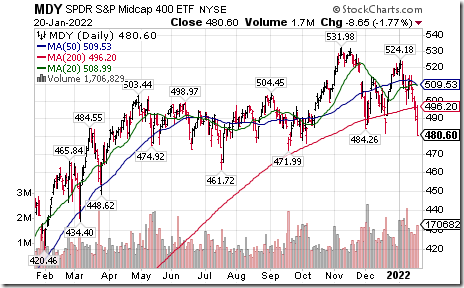
Mid-cap 400 SPDRs $MDY moved below $481.48 and 484.26 completing a double top pattern.
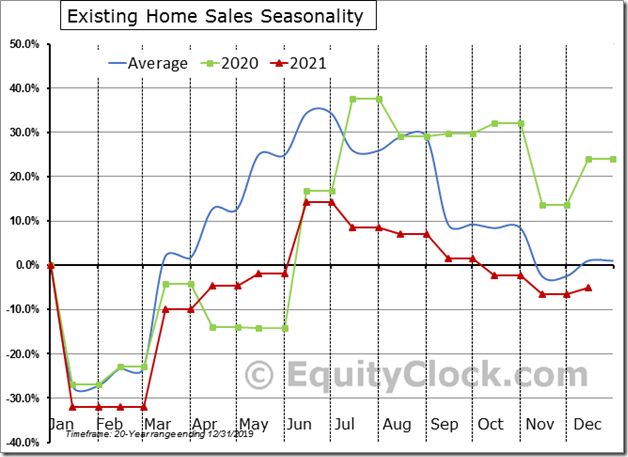
US Existing home sales fell by 5.0% (NSA) in 2021, which is the second weakest annual performance of the past decade, lagging only the 11.7% calendar-year decline recorded in 2018. Housing tends to be a leading indicator for the economy and the equity market. $STUDY $MACRO $ITB $XHB $WOOD #Economy #Housing
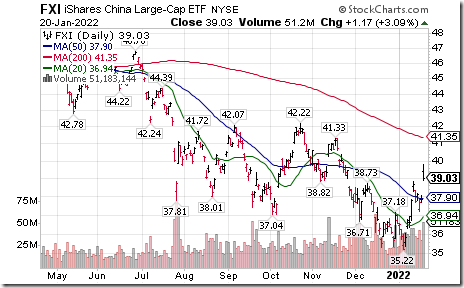
China large cap iShares $FXI moved above $38.73 extending a short term uptrend.
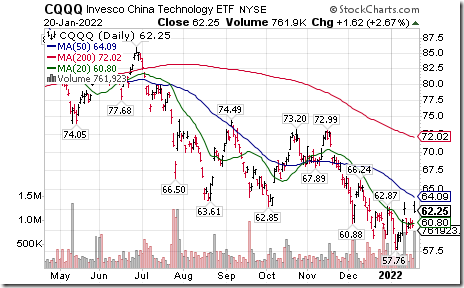
Strength in Chinese stocks was led by large cap stocks in the retail/technology sector including $JD $BIDU and $BABA. China technology ETF $CQQQ has completed a short term reverse Head & Shoulders pattern on a move above $63.35 Seasonal influences are strongly favourable to early March. If a subscriber to EquityClock, see seasonality chart at https://charts.equityclock.com/invesco-china-technology-etf-nysecqqq-seasonal-chart
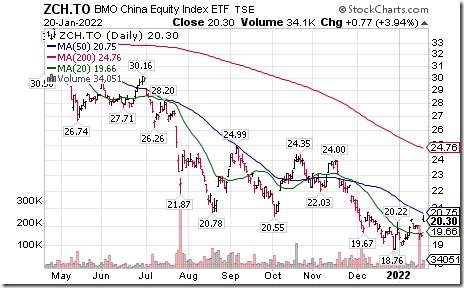
BMO China ETF $ZCH.CA moved above $20.22 completing a short term reverse Head & Shoulders pattern. Seasonal influences are highly favourable to late February and frequently to late April. If a subscriber to EquityClock, see seasonality chart at
https://charts.equityclock.com/bmo-china-equity-index-etf-tsezch-to-seasonal-chart
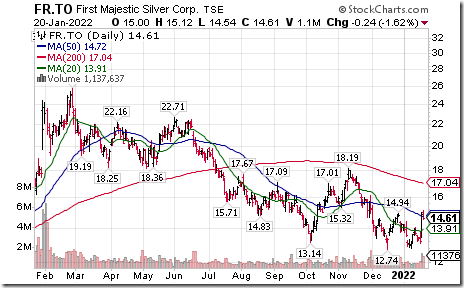
Precious metal stocks continue moving higher. First Majestic Silver $FR.CA moved above Cdn$14.94 completing a double bottom pattern. Seasonal influences are favourable until at least late February and frequently into summer. If a subscriber to EquityClock, see seasonality chart at
https://charts.equityclock.com/first-majestic-silver-corp-tsefr-seasonal-chart
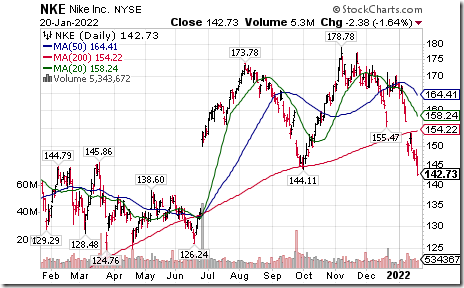
Nike $NKE a Dow Jones Industrial Average stock moved below $144.11 extending an intermediate downtrend.
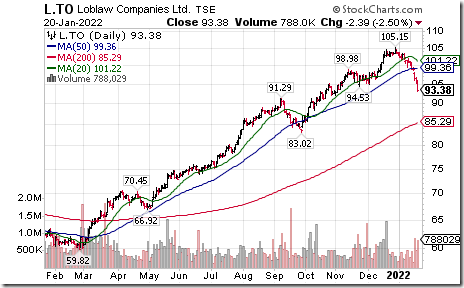
Loblaw Companies $L.CA a TSX 60 stock moved below intermediate support at $94.53
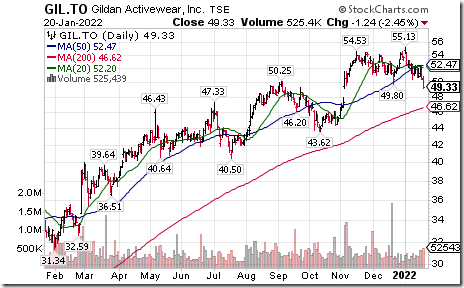
Gildan Activewear $GIL.CA a TSX 60 stock moved below $48.50 completing a double top pattern.
Trader’s Corner
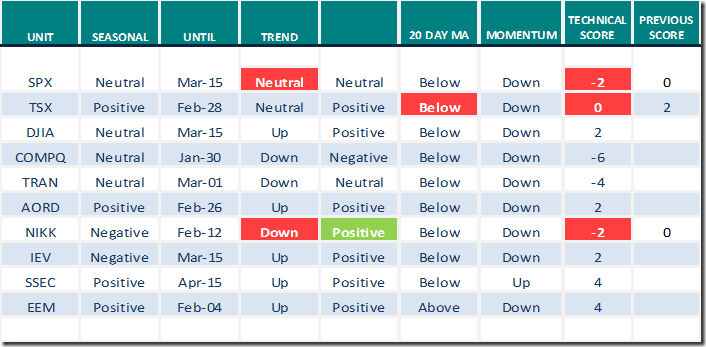
Equity Indices and Related ETFs
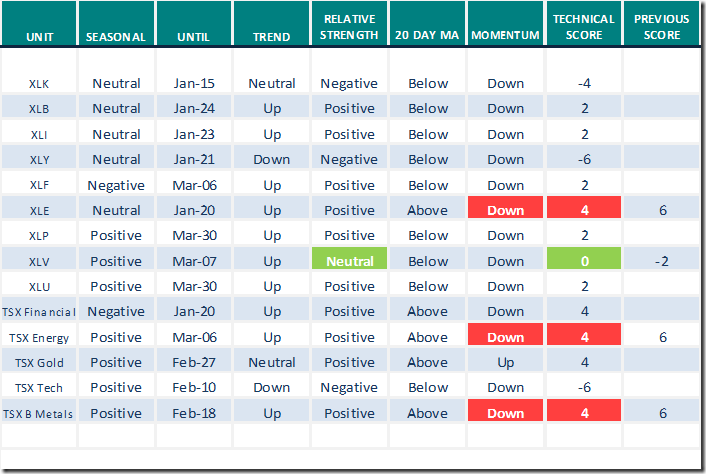
Daily Seasonal/Technical Equity Trends for Jan.20th 2022
Green: Increase from previous day
Red: Decrease from previous day
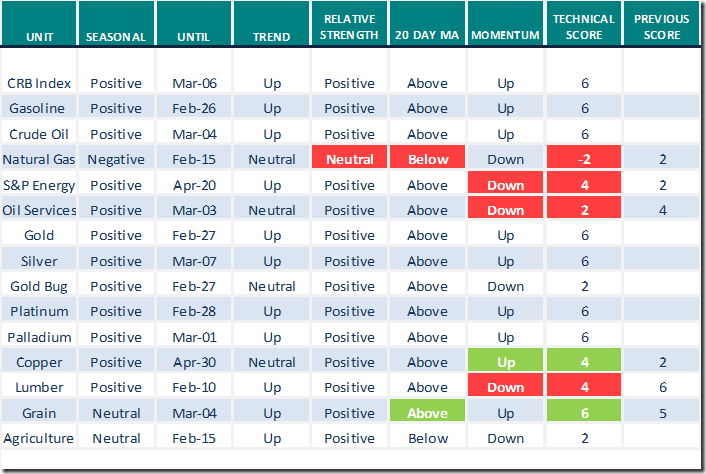
Commodities
Daily Seasonal/Technical Commodities Trends for Jan.20th 2022
Green: Increase from previous day
Red: Decrease from previous day
Sectors
Daily Seasonal/Technical Sector Trends for Jan.20th 2021
Green: Increase from previous day
Red: Decrease from previous day
All seasonality ratings are based on performance relative to the S&P 500 Index (except TSX)
Link offered by a valued provider
Sprott clearly is bullish on the precious metals sector. That’s not a surprise. However, the enclosed report offers an extensive and convincing factual report that supports the idea and is worth reading
Sprott Monthly Report: 2022 Top 10 Watch List
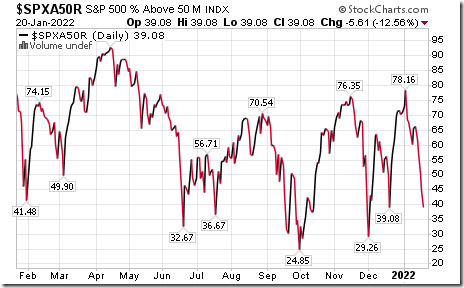
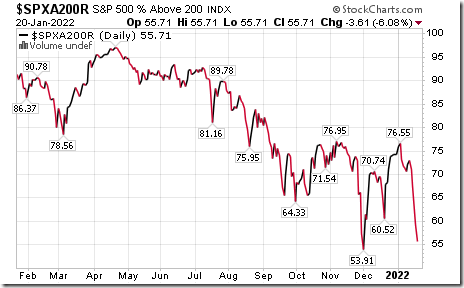
S&P 500 Momentum Barometers
The intermediate term Barometer plunged another 5.61 to 39.08 yesterday. It changed from Neutral to Oversold on a move below 40.00, but has yet to show signs of bottoming.
The long term Barometer dropped another 3.81 to 55.71 yesterday. It remains Neutral and continues to trend down.
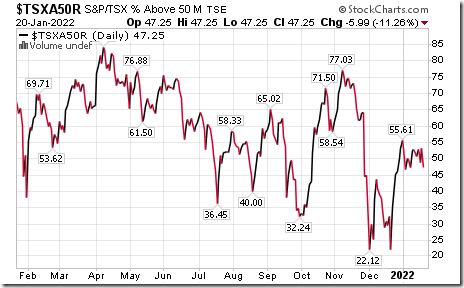
TSX Momentum Barometers
The intermediate term Barometer dropped 5.99 to 47.25 yesterday. It remains Neutral.
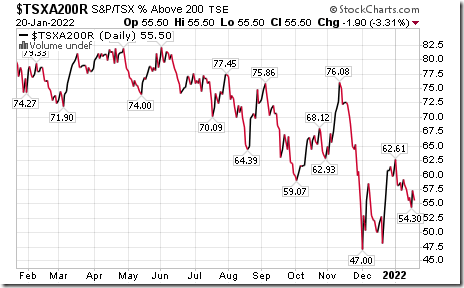
The long term Barometer slipped 1.90 to 55.50 yesterday. It remains Neutral.
Disclaimer: Seasonality and technical ratings offered in this report and at
www.equityclock.com are for information only. They should not be considered as advice to purchase or to sell mentioned securities. Data offered in this report is believed to be accurate, but is not guaranteed
This post was originally publised at Vialoux's Tech Talk.


