
by Talley Léger, Invesco Canada
Emerging market underperformance has entered a late stage, but Talley Léger says potential opportunities have begun to present themselves across the region.
As we head into the new year, I believe a fair assessment of an array of forces suggests a mixed outlook for Chinese and emerging market (EM) stocks. However, EM stocks have been so deeply underowned and out of favour that I worry about being too pessimistic. For one, ongoing improvement in Chinese financial conditions could brighten the outlook.
Moreover, it seems COVID-19 has generally had a diminishing impact on the global economy, the wild card being the scope and duration of possible lockdowns. If concerns about the Omicron variant fade sooner than later, the U.S. dollar could soften and investor risk appetite may firm, adding further upside potential to my sober view.
Where are we in the market cycle?
EM stocks have underperformed their developed market (DM) counterparts for more than 11 years, so the trend isn’t our friend.1 From my lens, we remain in the later stages of EM underperformance.
True, EM stocks – capturing corporate performance in the developing countries (e.g., China, India, Brazil, South Korea, Russia) – outperformed significantly in 2016, 2017, and 2020.1
In 2018 and 2019, however, trade wars, an associated shift in investor sentiment, outflows, and currency fluctuations caused EM equities to deviate far below levels justified by generally stable economic fundamentals, in my view.
Also, Chinese policymakers slammed the brakes in early 2021 to rein in the froth and excess they thought was developing. As a result, Chinese stocks lagged their U.S. counterparts last year, alongside slowing money growth.
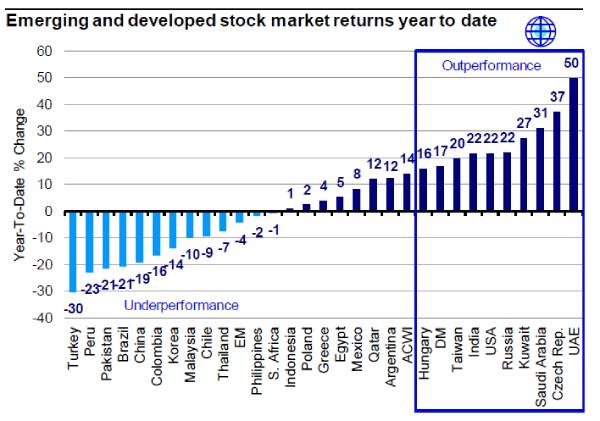
As shown in Figure 1, Chinese and U.S. stocks have been exceptional under and outperformers, respectively. Excluding those dominant outliers, however, EM stocks have actually been holding their own relative to DM stocks. In fact, Russian, Indian, and Taiwanese stocks, to name a few, have outperformed the global average year to date (Figure 1).
Figure 1: Selectivity is crucial in a difficult environment. Averages can be deceiving, and a closer look reveals some outstanding EM countries.
Emerging and developed stock market returns: % change 12/31/20 to 11/30/21
Are there potential monetary catalysts?
In the U.S., the Federal Reserve (Fed) has responded to renewed economic expansion and inflationary pressures by accelerating its plan to reduce large-scale asset purchases, preparing to raise interest rates, and flattening the yield curve to slow down the economy.
By contrast, past policy tightening in China has given way to renewed policy easing, which could boost the outlook for EM stocks. Chinese monetary authorities have cut reserve requirements for their banks, injected capital back into their system, and fostered a renewed decline in interbank rates.
That’s important because there has been a strong inverse relationship between financial conditions, which are influenced by a country’s central bank, and manufacturing activity over time. Specifically, easy financial conditions have been tailwinds for economic growth, and tight financial conditions have been headwinds for economic growth.
In the U.S., financial conditions remain easy, but a hawkish Fed, flatter yield curve, and strong U.S. dollar have coincided with slower manufacturing activity.
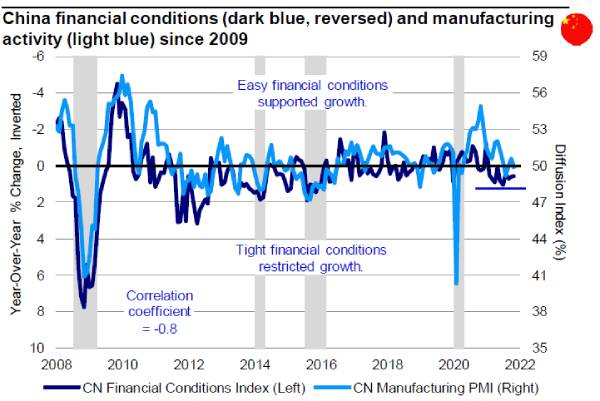
After a phenomenally successful reflationary campaign in 2020, Chinese policymakers did an about-face in early 2021, producing tight financial conditions and contracting manufacturing activity. However, renewed monetary acceleration could provide a much-needed tailwind for Chinese growth (Figure 2).
Figure 2: Chinese financial conditions have tightened, but sequential improvement could eventually provide a tailwind for emerging economies.
China financial conditions (dark blue, reversed) and manufacturing activity (light blue) since 2009: Easy financial conditions have supported growth, while tight financial conditions have restricted growth.
What about possible economic catalysts?
Business activity has softened across regions, including an acute slowing of the second-largest economy in the world, China. Chinese real gross domestic product (GDP) growth has downshifted from a double-digit pace in the first quarter of 2021 to a mid single-digit pace in the third quarter.
By contrast, an inflationary boom in the U.S., led by the services side of the economy, has helped to keep global activity afloat.
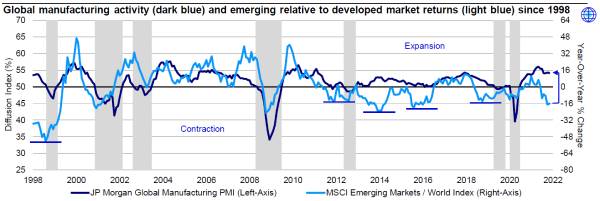
Historically, the direction of global manufacturing output has helped inform allocation decisions between EM and DM stocks. But worldwide turnover isn’t a perfect indicator. Recently, EM stocks have deviated far below levels justified by generally stable economic fundamentals, in my view. Such negative divergences have occurred several times before, and when they did, EM stocks resolved in an upward fashion (Figure 3).
Figure 3: EM stocks usually outperformed DM stocks when the global economy was growing. However, EM stocks have overreacted to the downside and may be due for a catchup phase.
Global manufacturing activity (dark blue) and emerging relative to developed market returns (light blue) since 1998.
Learn more from our Playbook
The Equity Strategy Playbook leverages Invesco’s resources as a leading global asset management firm, including decades of research experience, to gather and present the indicators that we believe matter most for equity performance in a visual and digestible format – all in one place.
To see the complete visual representation of my emerging market outlook, click here.
1 Sources: Bloomberg L.P., Invesco, 9/30/10 to 11/30/21. Based on the MSCI Emerging Market Index and the MSCI World Index. The MSCI Emerging Market Index measures the equity market performance of emerging markets. The MSCI World Index measures the equity market performance of developed markets and includes the U.S., eurozone, Japan and Canada.
This post was first published at the official blog of Invesco Canada.