by Don Vialoux, EquityClock.com
Technical Notes released yesterday at
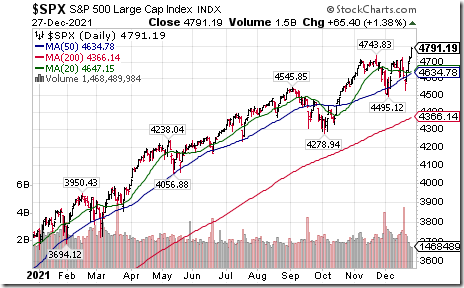
S&P 500 Index $SPX moved above $4,743.83 to an all-time inter-day high. S&P 500 SPDRs $SPY moved above 471.88 to an all-time high.
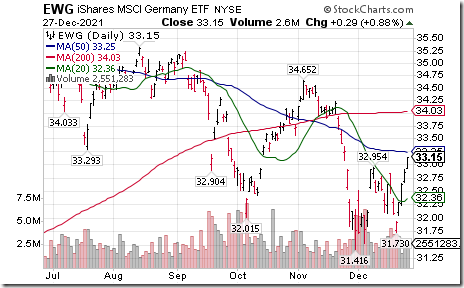
Germany iShares $EWG moved above $32.95 completing a short term double bottom pattern.
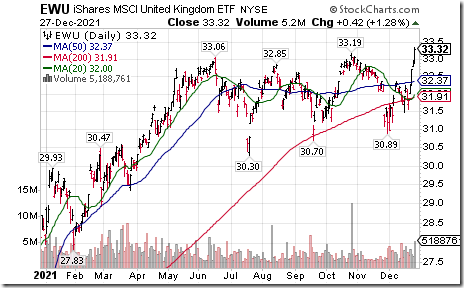
United Kingdom iShares $EWU moved above $33.19 to an all-time high extending an intermediate uptrend.
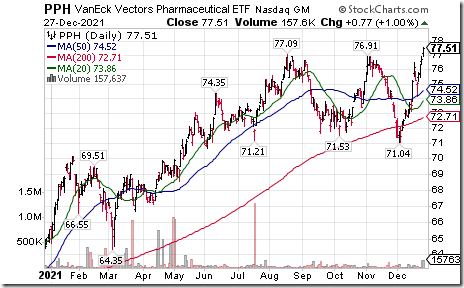
Pharmaceutical ETF $PPH moved above $77.09 to an all-time high extending an intermediate uptrend. Seasonal influences are favourable to the end of March.
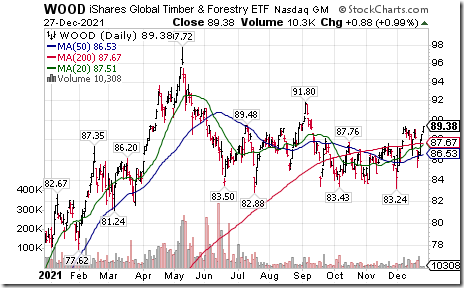
Timber and Forestry iShares $WOOD moved above $89.30 resuming an intermediate uptrend. Seasonal influences are favourable to the end of January and frequently to the end of April. If a subscriber to EquityClock, see seasonality chart at https://charts.equityclock.com/ishares-global-timber-forestry-etf-nasdwood-seasonal-chart
Editor’s Note: Responding to recent passage of the Infrastructure bill.
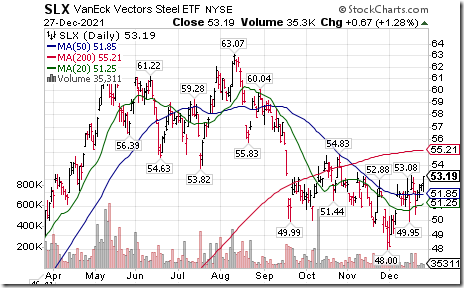
Steel ETF $SLX moved above $53.08 completing a short term reverse Head & Shoulders pattern. Responding to recent passage of the Infrastructure bill. Seasonal influences are favourable to late April. If a subscriber to EquityClock, see seasonality chart at https://charts.equityclock.com/vaneck-vectors-steel-etf-nyseslx-seasonal-chart
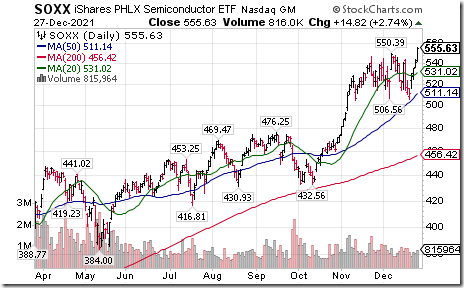
Semi-conductor iShares $SOXX moved above $550.39 to an all-time high extending an intermediate uptrend. Seasonal influences are favourable to late March. If a subscriber to EquityClock, see seasonality chart at https://charts.equityclock.com/ishares-phlx-semiconductor-etf-nasdsoxx-seasonal-chart
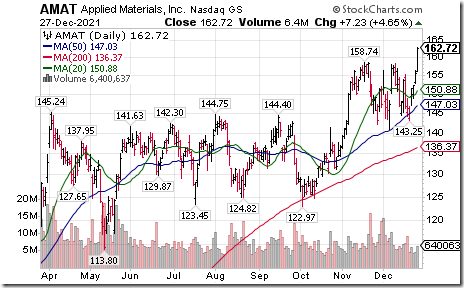
Applied Materials $AMAT a NASDAQ 100 stock moved above $158.74 to an all-time high extending an intermediate uptrend. Seasonal influences are favourable to the end of March. If a subscriber to EquityClock, see seasonality chart at https://charts.equityclock.com/applied-materials-inc-nasdaqamat-seasonal-chart
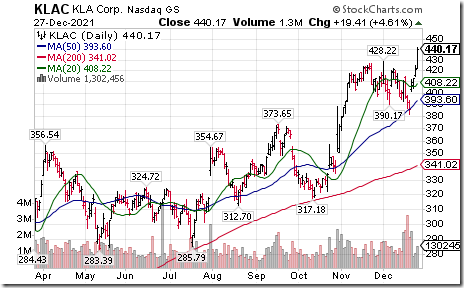
KLA Corp $KLAC a NASDAQ 100 stock moved above $428.22 to an all-time high extending an intermediate uptrend. Seasonal influences are favourable to late March. If a subscriber to EquityClock, see seasonality chart at https://charts.equityclock.com/kla-tencor-corporation-nasdaqklac-seasonal-chart
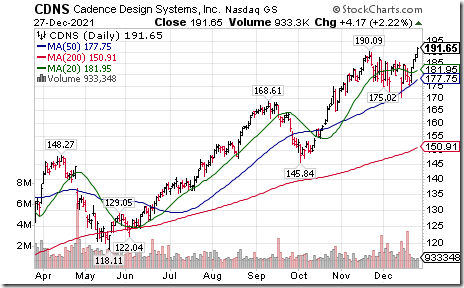
Cadence Design $CDNS a NASDAQ 100 stock moved above $190.09 to an all-time high extending an intermediate uptrend. Seasonal influences are favourable to mid-March. If a subscriber to EquityClock, see seasonality chart at https://charts.equityclock.com/cadence-design-systems-inc-nasdcdns-seasonal-chart
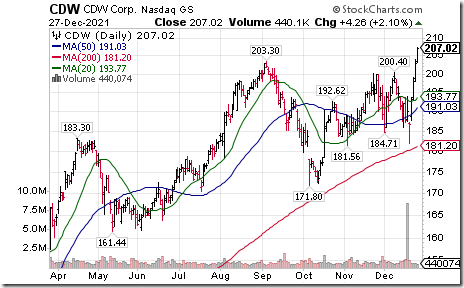
CDW Corp $CDW a NASDAQ 100 stock moved above $203.30 to an all-time high extending an intermediate uptrend.
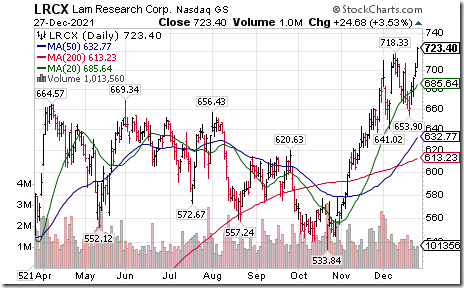
Lam Research $LRCX a NASDAQ 100 stock moved above $718.33 to an all-time high extending an intermediate uptrend. Seasonal influences are favourable to the beginning of June. If a subscriber to EquityClock, see seasonality chart at https://charts.equityclock.com/lam-research-corp-nasdlrcx-seasonal-chart
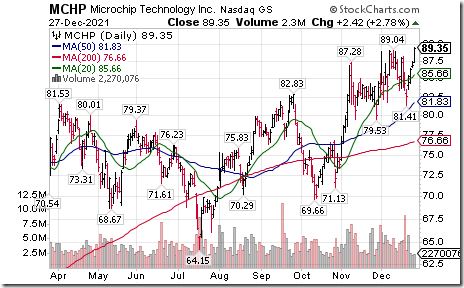
Microchip Technology $MCHP a NASDAQ 100 stock moved above $89.04 to an all-time high extending an intermediate uptrend. Seasonal influences are favourable to the end of April. If a subscriber to EquityClock, see seasonality chart at https://charts.equityclock.com/microchip-technology-inc-nasdaqmchp-seasonal-chart
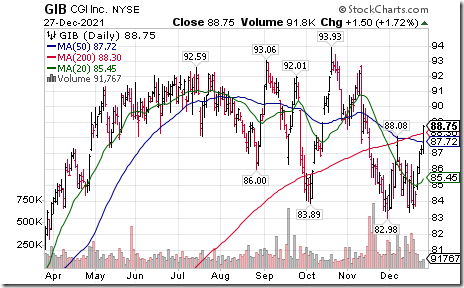
CGI Group $GIB a TSX 60 stock moved above US$88.08 setting a new intermediate uptrend. Seasonal influences are favourable to the beginning of February. If a subscriber to EquityClock, see seasonality chart at https://charts.equityclock.com/cgi-group-inc-nysegib-seasonal-chart
Trader’s Corner
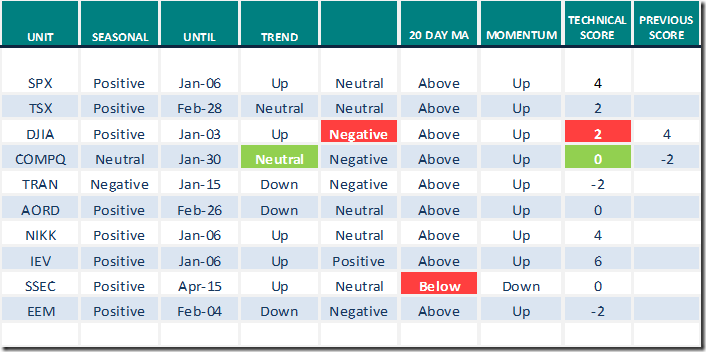
Equity Indices and Related ETFs
Daily Seasonal/Technical Equity Trends for Dec.27th 2021
Green: Increase from previous day
Red: Decrease from previous day
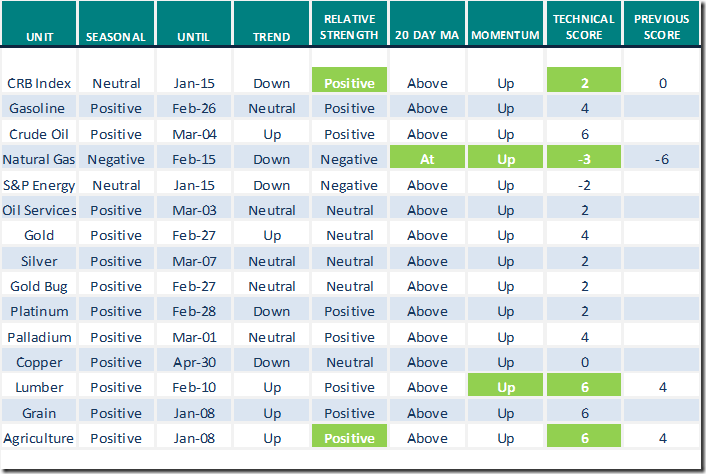
Commodities
Daily Seasonal/Technical Commodities Trends for Dec.27th 2021
Green: Increase from previous day
Red: Decrease from previous day
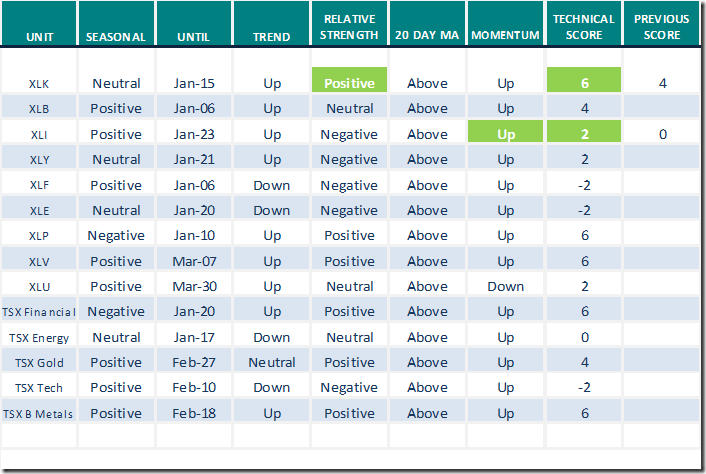
Sectors
Daily Seasonal/Technical Sector Trends for Dec.27th 2021
Green: Increase from previous day
Red: Decrease from previous day
All seasonality ratings are based on performance relative to the S&P 500 Index (except TSX)
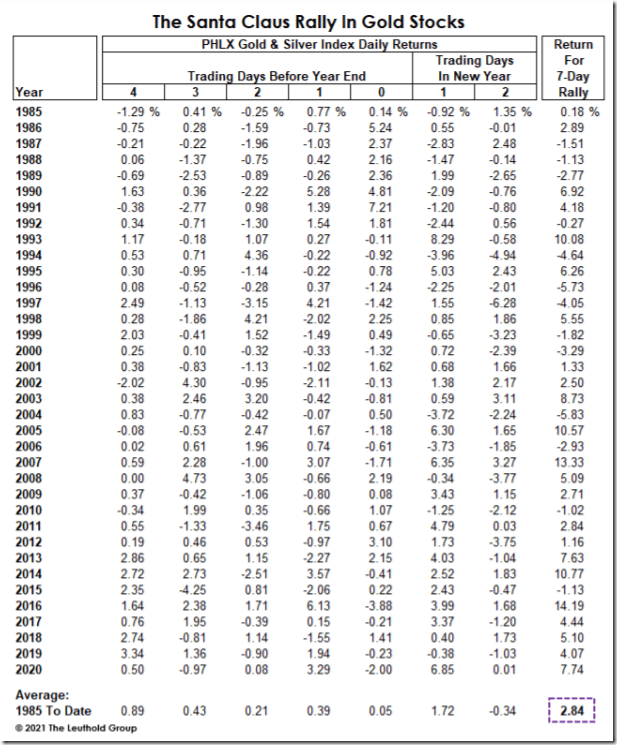
Gold equity indices at this time of year
Strongest seven consecutive trading days in the year for global gold equity indices since 1985 have been the last five trading days of the year to the first two trading days of the following year. Average return per period was 2.84%. With the end of tax loss selling in the sector near the end of December, the recovery bounce during the current period could be greater than average.
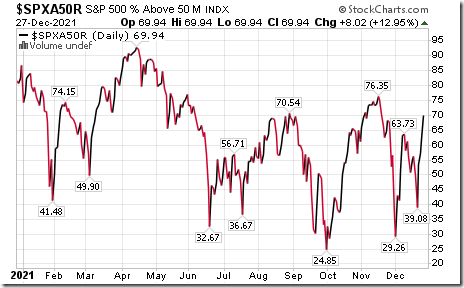
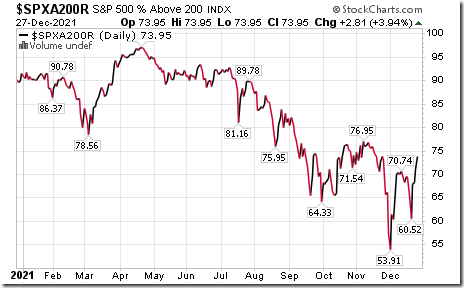
S&P 500 Momentum Barometers
The intermediate term Barometer gained another 8.02 to 69.94 yesterday. It remain Overbought. Trend is up.
The long term Barometer added 2.81 to 73.95 yesterday. It remains Overbought. Trend is up.
Disclaimer: Seasonality and technical ratings offered in this report and at
www.equityclock.com are for information only. They should not be considered as advice to purchase or to sell mentioned securities. Data offered in this report is believed to be accurate, but is not guaranteed
This post was originally publised at Vialoux's Tech Talk.


