It’s time to rebalance the lopsided 60/40 portfolio with alternative sources of diversification and return.
01 - The 60/40 portfolio today
The 60/40 portfolio is becoming increasingly lopsided. Stocks are near all-time highs, but higher concentrations and stretched valuations may create embedded risks. At the same time, bonds face the compounding challenges of ultra-low yields, yield-eroding inflation, and a potential rising rate cycle.
02 - Adding balance with alternatives
The next evolution of portfolio construction may require rethinking classic asset allocations by adding alternative sources of diversification and return.
03 - Three Ds of alternative diversifiers
When looking for an alternative investment to rebalance portfolios, we believe it should offer the potential for diversification, durability, and defensiveness.
*****
The 60/40 portfolio today
The returns of 60/40 portfolio over the past decades have been robust. For stocks, the past decade was an outlier in terms of high returns with record-low volatility. For bonds, they rode a once-in-a-generation rally as rates fell to near zero. Today, the 60/40 framework is coming under pressure. Equity markets are near all-time highs, but valuations are stretching, and security concentration is increasing. At the same time, bonds are contending with the challenges of ultra-low yields, yield-eroding inflation, and a potential rising rate cycle. The net result is an unbalanced portfolio increasingly driven by equity exposure and with potentially less diversification than before.
The 60%: Less diversified and stretched valuations
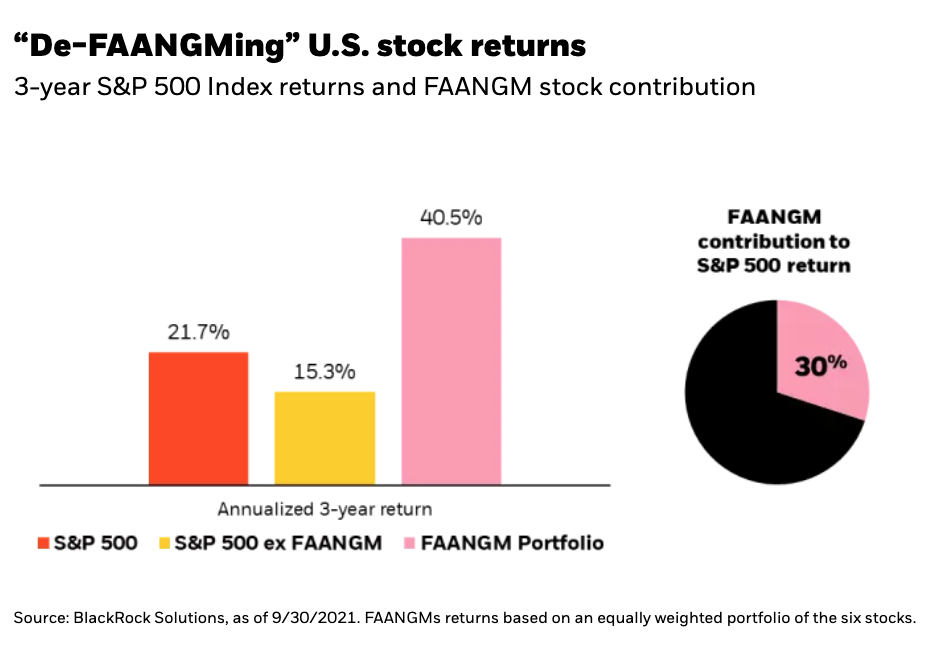
Today, U.S. stocks are less diversified and stand at historically expensive levels compared to the past 20 years. In the S&P 500 Index, the exponential growth rates of the “FAANGM” stocks (i.e., Facebook1, Amazon, Apple, Netflix, Google, Microsoft) has been a major force driving equity returns higher. As these companies grew from scrappy startups to pillars of the economy, they have fundamentally reshaped the composition of major indices. These six stocks now account for over $9 trillion in market cap or about 23% of the entire S&P 500 Index. Just three years earlier, they accounted for about $4 trillion or 17% of the index. Going back 5 years, and those figures are about $2.5 trillion and 12%.2
The chart below “de-FAANGMs” U.S. equity returns and compares the performance of the S&P 500 Index, the S&P 500 ex. FAANGM stocks (i.e., the other 494 stocks in the index), and a portfolio of only FAANGM stocks. As you can see, the outsized growth rates of the FAANGM stocks significantly boosted equity returns. More importantly, over the past three years, these handful of stocks have made up about 30% of the total return. Consequently, with the continued dominance of these megafirms, investors may be deriving more and more of their return from fewer and fewer stocks.
Turning to valuations, we can look at the Cyclically Adjusted Price-to-Earnings Ratio (“CAPE ratio”) to measure the how expensive equities have become. The CAPE looks at the value of the stock market’s earnings after adjusting for inflation to assess long-term financial performance, while isolating the impact of economic cycles. An extremely high CAPE ratio means that aggregate stock prices are substantially higher than earnings would indicate and, therefore, overvalued.
What we find by looking at the S&P 500 is that the CAPE ratio is over 35—making equities more expensive than any other time in the past 20 years except during the 2001 Dot-Com Bubble.
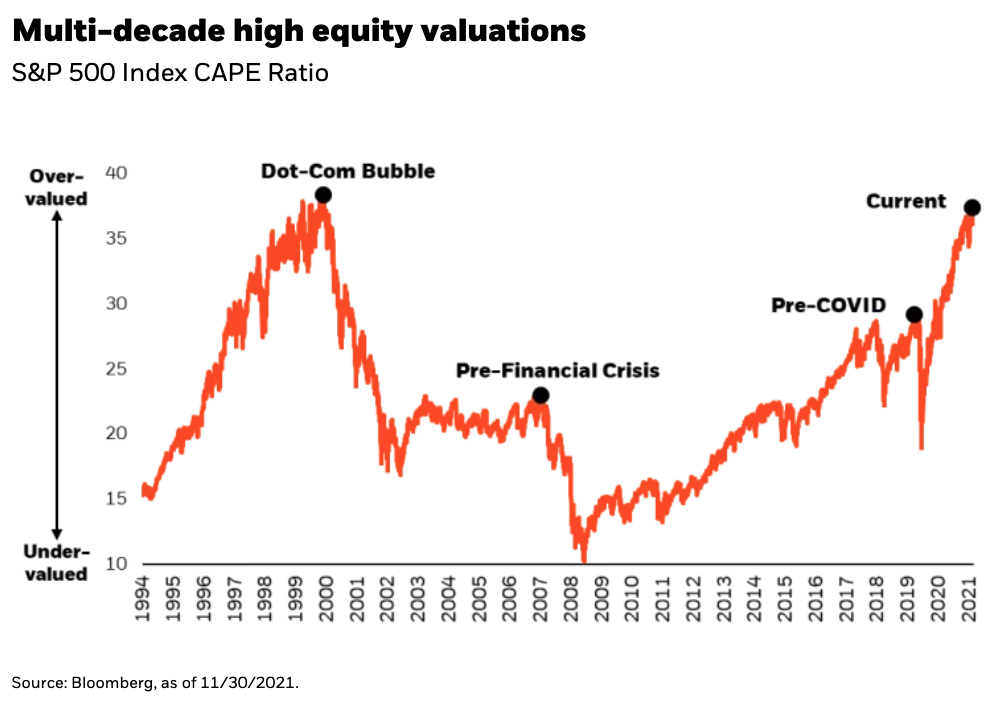
While this is only one measure of valuations, looking at stocks through a myriad of other value metrics reveals similar results: equity valuations are at multi-decade highs. While equity prices can be disconnected from fundamentals over long periods of time, exceptionally high valuations may point to muted returns over the medium term.
With the average investment advisor holding 75% of their equity allocation in U.S. stocks, it may be time to question if what worked in the past will continue to work in the future.3
The 40%: Low yields, higher inflation, and rising rates
The low-rate environment has been a well-known challenge for bonds investors for some time, resulting in a global scarcity in higher yielding bonds. Looking at the Bloomberg Barclays Multiverse Index as a proxy for the entire $71 trillion investable global bond market today, we see a “4-and-4 environment” with less than 4% of bonds yielding more than 4%. Ten years ago, the share of bonds yielding more than 4% was 17.7% and just five years ago it was 7.5%.4
To compound this issue, persistently higher inflation is eroding the already challenged return potential of bonds with inflation-adjusted, or real yields, starkly negative across major sectors. Viewing inflation across a 5-year timeframe demonstrates just how high of a hurdle inflation poses for future bond returns. The chart below outlines the real yields of different fixed income asset classes based on the current nominal yield minus the market implied rate of inflation over the next five years of 2.8%.
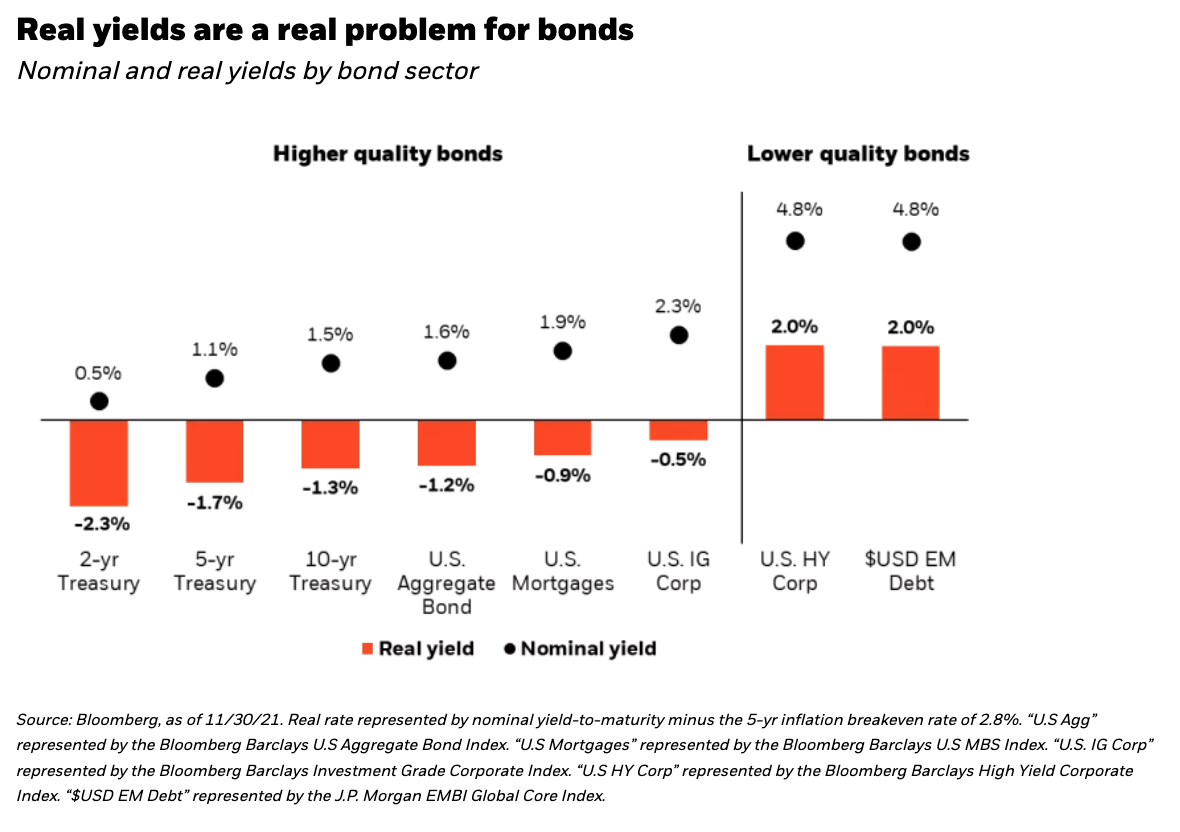
Investment grade quality bonds that typically make up the bulk of core bond allocations such as Treasuries, mortgages, and investment grade corporates all result in strongly negative annual rates of real yield. Looking at the U.S. Aggregate Bond Index as a proxy for a core bond allocation, the expected real yield is -1.2% over the next 5 years. To gain any positive real yield, investors must look at lower quality holdings such as U.S. high yield corporate bonds or emerging market debt to gain low single-digit yields. But be aware, reaching out into lower credit quality securities like high yield and emerging market debt comes with higher default risk, more volatility, and potentially greater correlation to equities—undercutting the role of bonds as equity diversifiers in a 60/40 portfolio.
Unfortunately, the likely catalyst for a recovery in real bond yields comes with a catch as well. The Fed can rebalance the real yield equation by normalizing interest rates over the coming years—effectively increasing nominal yields on bonds and potentially dampening inflation at the same time. But in the short-term, as interest rates rise, bond price returns will fall as well, creating a drag on total returns until rates normalize.
Going forward, core bonds may not provide the same level of return boost as they have in the past, making stock returns (and the accompanying volatility) an even greater driver of future 60/40 portfolio results.
Adding back balance with alternatives
With the 60/40 portfolio becoming increasingly unbalanced, now may be the time to consider alternatives that can add diversification and target new sources of return. One of the ways to do this is to add strategies that go long AND short5 securities.
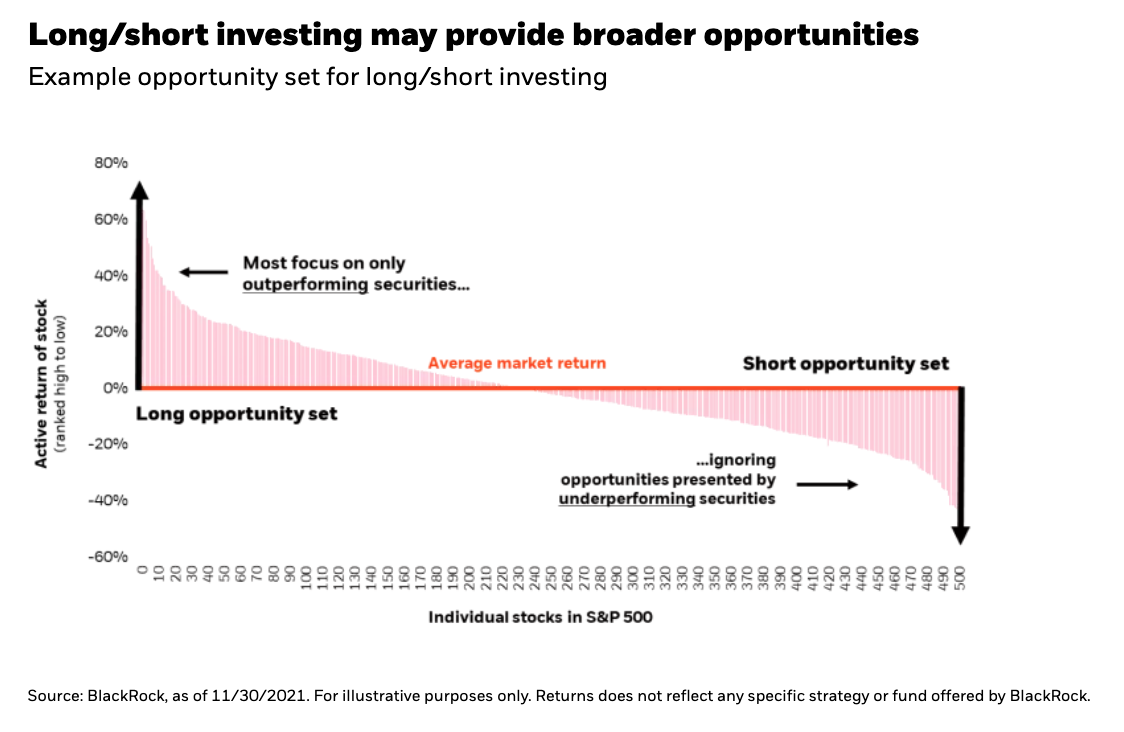
Unlike traditional long-only strategies that target “best-in-class” securities that are expected to outperform the market, long/short strategies seek to target the entire opportunity set—what is believed to be the best and the worst investments available. They seek to generate returns by going long companies that will outperform and going short companies that will underperform. In this way they can generate returns on both sides of the market and tap into an opportunity set that long-only investments cannot access.
Beyond a more expansive opportunity, structuring the portfolio to be “market neutral” where long and short positions are relatively matched, can result in a return stream that captures the unique differences in security returns across the market. In effect, the ups and downs of the overall market, or beta, is largely stripped out of the return stream.
From a portfolio construction perspective, this type of alternative strategy enables investors to tap into an alternative source of return, called security dispersion, that is not currently captured in 60/40 portfolios.
What is security dispersion? Dispersion is the difference between winners and losers in the market. High dispersion implies a wide difference between winners and losers, while low dispersion implies a narrow difference between winners and losers. Long/short strategies can thrive in high dispersion environments because they can go long companies who may become outsized winners and go short companies that may become relative losers.
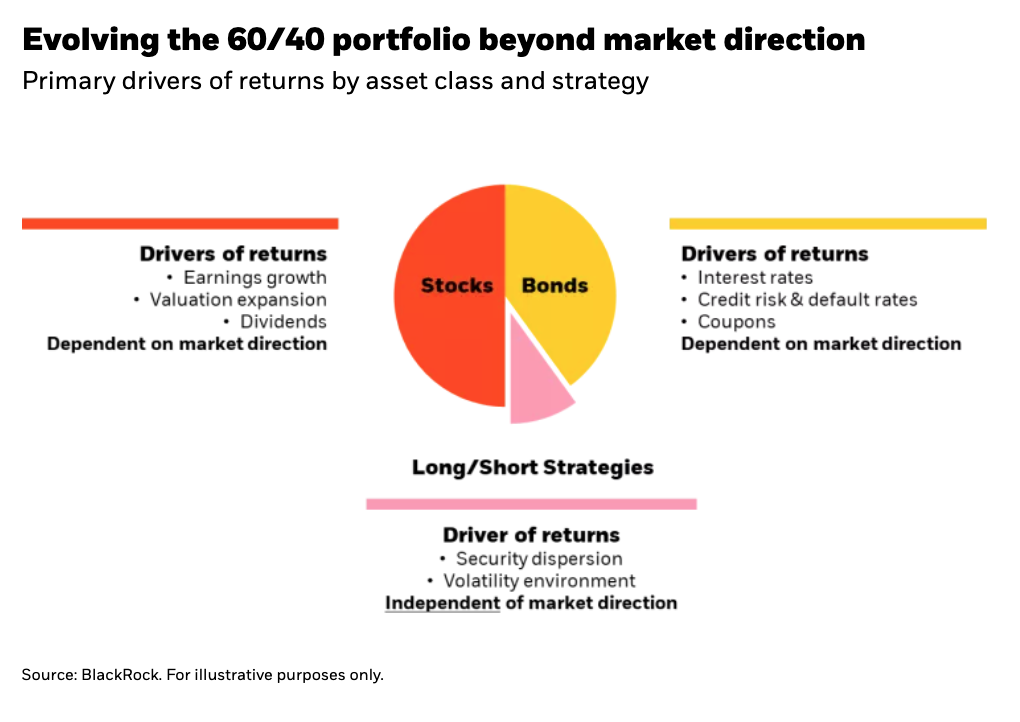
Taking advantage of security dispersion can act as another form of return in a portfolio that a traditional 60/40 construct overlooks. Why? The returns of a 60/40 portfolio are based on market direction. Equity returns are driven by growth in earnings, the valuation multiple of those earnings, and to a lesser degree the payment of dividends. These are heavily dependent on the direction of economic conditions and overall direction of equity markets. Similarly, bond returns are driven by prevailing interest rates, credit spreads, and coupon payments. If market returns are muted, buy-and-hold asset allocation becomes considerably less effective.
Dispersion, however, is not dependent on market direction. It can exist in markets with low absolute returns or even downward trending markets—the very time a 60/40 portfolio needs alternative sources of return the most.
 The three Ds of alternative diversifiers
Alternative investments, and in particular long/short strategies, vary widely. Understanding the characteristics of a strategy is crucial because many in the same category or with similar labels may produce vastly different portfolio outcomes.
When looking for an alternative to diversify a portfolio, we believe it’s key to ask if it has historically exhibited the three Ds: diversification, durability, and defensiveness.
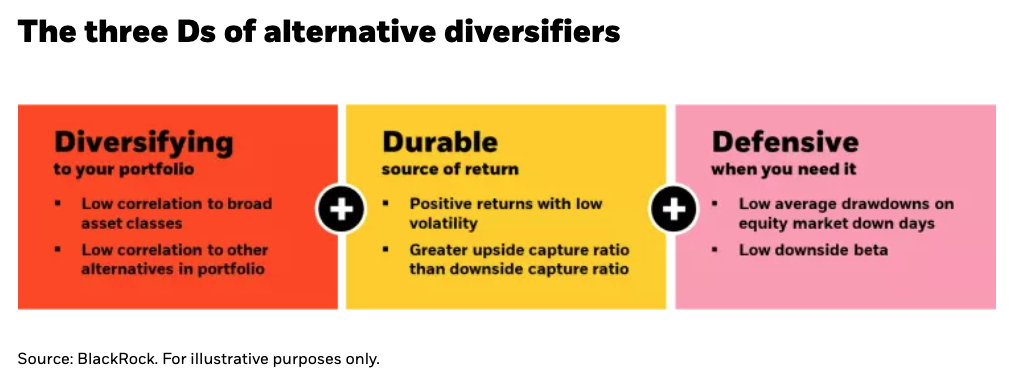
First, does the strategy diversify your current portfolio? A telling characteristic to look for is low correlations to other broad asset classes in your portfolio—think risky assets like U.S. and global equities, high yield bonds, or private markets. Many alternative strategies offer strong double-digit returns, but with very high correlation to equities and other risky assets—essentially doubling down on the pre-dominant risk you have in the portfolio. Others offer more modest returns but deliver them without the same level of equity-related risk. Consider finding a middle ground between return potential and low correlations when evaluating alternative diversifiers. Another dimension of an alternative’s diversification potential is the correlation to other alternatives you may already have in your portfolio. A low correlation between another liquid alternative can signal that they are complementary and additive to your current allocation.
Next, does the strategy have a history as a durable source of return? As a long-term holding in an asset allocation, it is key that your capital is put to good use to produce positive returns. Consistent returns with relatively low volatility can help balance out the loss of return from other low risk asset classes like core bonds, but still deliver the stability that has made core bond allocations attractive in the past. Furthermore, a positively skewed upside/downside capture ratio (one where you capture more upside on up days, than downside on down days) can signal that the strategy is not just providing a watered-downed version of market beta, but rather, demonstrating a source of durable return.
Finally, is the strategy defensive when you need it? The timing of returns matter. Potential ways to gauge this is examining how the strategy has historically performed on down equity market days or during specific bouts of market stress—the time diversification is most needed. When equity markets sell off, shallower drawdowns or even stable to flat returns from an alternative diversifier can indicate defensive qualities. An alternative diversifier may not always exhibit defensiveness across all market environments or events—all investments have ups and downs—but what is essential is the alternative’s diversifying behavior doesn’t consistently disappear at the same time other assets in your portfolio are selling off. An alternative diversifier that is defensive when other assets are under pressure may allow your total portfolio to better weather different market environments.
The long and short of it
The classic 60/40 portfolio has become unbalanced. U.S. equities dominate returns but have become increasingly concentrated, and valuations have stretched. Bonds face several challenges including negative real bond yields and price return headwinds as rates rise. Alternative diversifiers may help to reduce equity market risk and boost flagging fixed income returns.
Long/short strategies have two major benefits for 60/40 portfolios. First, by going short companies they can greatly expand the opportunity set to generate returns. Second, by going long and short in equal amounts they can tap into changes in security dispersion. Dispersion is independent of market direction and can act as a new source of return that is not available in the 60/40 framework.
Finally, when looking for alternative diversifiers, we believe it’s best to ask the right questions. Is it diversifying to your current portfolio? Does it offer a durable source or return? Has it been defensive when the rest of your portfolio needed it most? Finding the right alternative to diversify your portfolio may help bring balance back to a lopsided asset allocation.
Copyright © Blackrock