
by Rick Rieder, Managing Director, Chief Investment Officer, Global Fixed Income, Blackrock
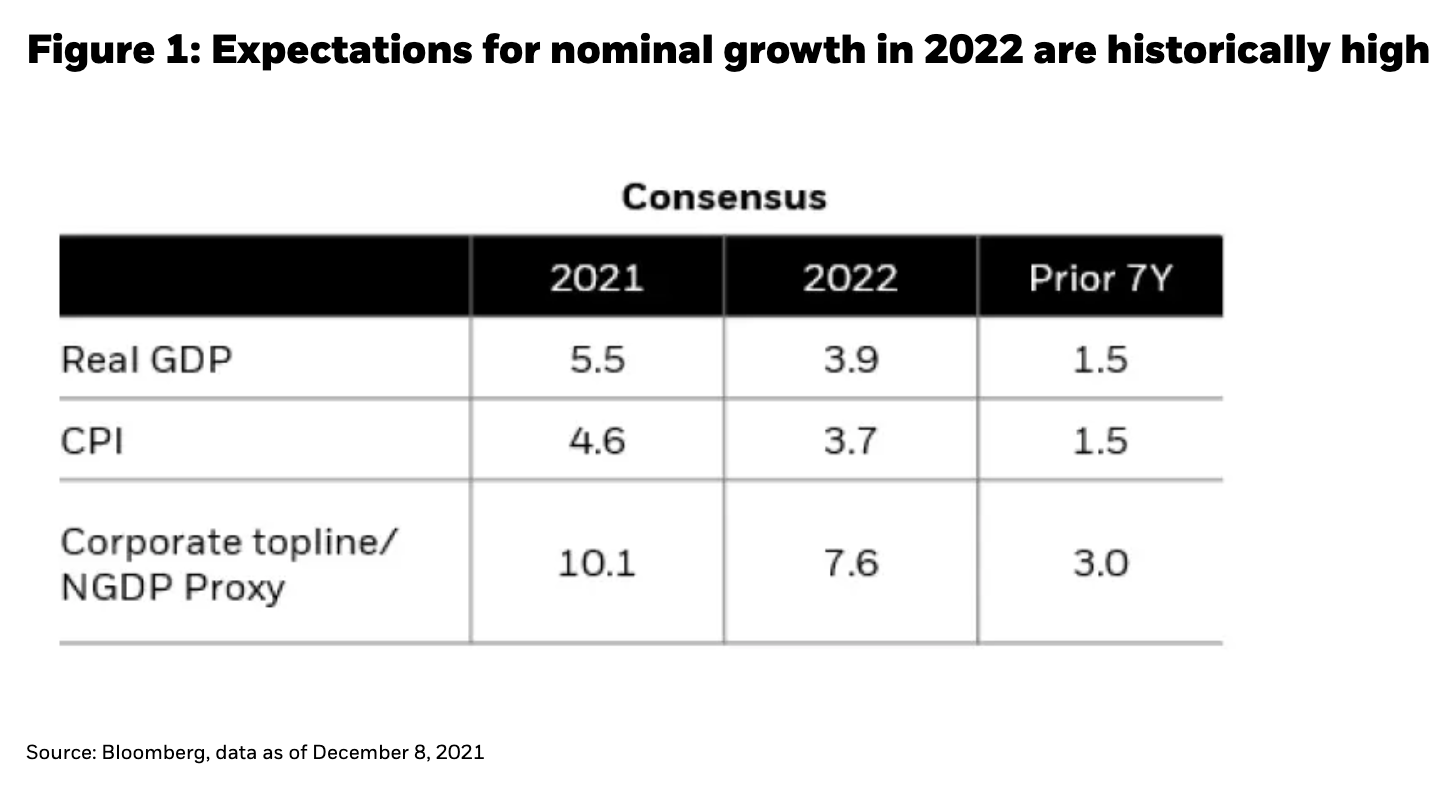
At the end of 2019, had we been told that a two-year pandemic was about to begin, we would have found it impossible to predict the set of returns that followed in subsequent years. Since the start of 2020, through 2021-to-date (through December 10), the S&P 500 has gained almost 50%, the Bloomberg-Barclays Long Treasury Index has gained 14%, while gold and oil have each gained roughly 18%. A rising tide of liquidity has floated many boats, raising the question of how investors should navigate a world in which liquidity is no longer rising, or at least, is not rising anywhere nearly as quickly. Nonetheless, any policy normalization in 2022 will almost certainly be reacting to a second consecutive year of huge nominal GDP growth (see Figure 1), making the composition of that growth, namely the quantities and prices components, of critical importance for investors. In this commentary we outline 11 themes (and some prognostications) that we think will drive investment returns in 2022.
1) Growth may surprise to the upside, underpinned by a labor market that should take unemployment rates to “eye-popping” low levels
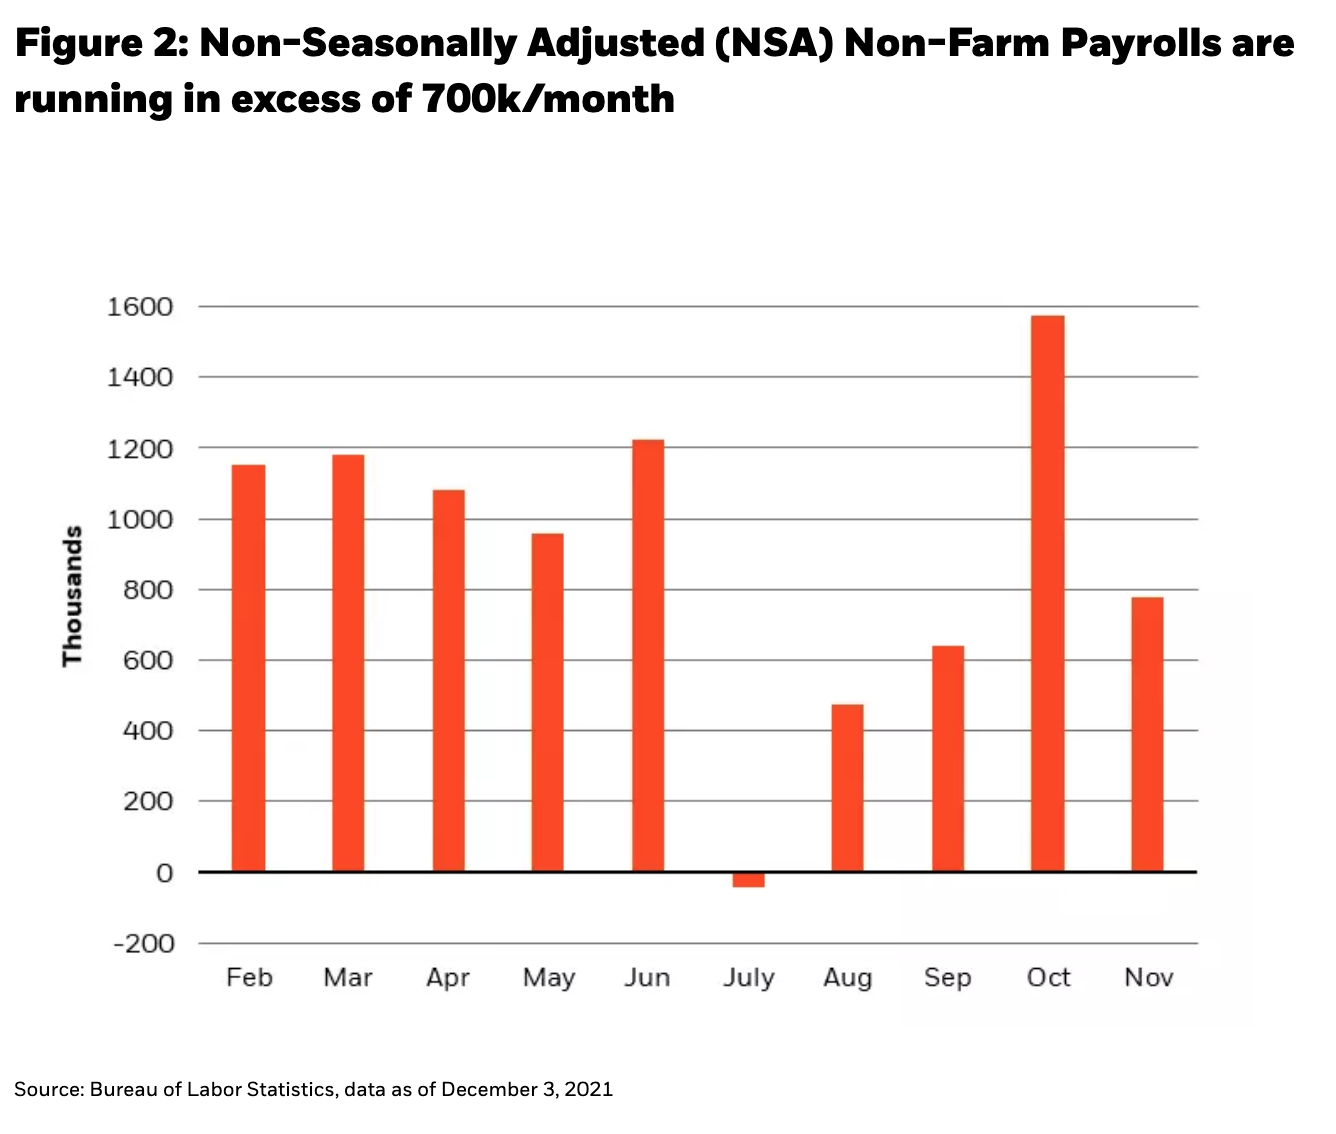
The supply of labor will determine the evolution of the labor market, rather than demand. Conservatively, assuming 200k-400k monthly nonfarm payroll gains over the course of 2022, wage growth that is in-line with that of the last 12 months, and no change in hours worked, we would witness an aggregate income gain for the labor force of about 7% over the course of 2022. And remarkably, in that event aggregate income would have grown by more than 14% since the pandemic began in February 2020. Yet this also means that about 3 million people will need to be added to the labor force – an effective “passing of the income baton” from fiscal stimulus to wages, a process that is well underway. While the numbers are volatile, non-seasonally adjusted payroll data suggests that well over 700k employees are being added to payrolls each month (on average, over the last 10 months, as displayed in Figure 2), including in November (much greater than the more widely followed seasonally adjusted number).
2) The need for speed will be fulfilled…. Here comes the velocity (of money)!
Historically, “tightening,” or “over-tightening,” policy was about corralling excessive credit growth (demand that was fueled by credit). However, today’s conditions are precisely the opposite: U.S. consumers have been paying down credit for a decade. There has been very little credit growth, much less excessive growth, largely due to an influx of cash via pandemic stimulus measures (indeed, there is about $2.5 trillion of excess savings on consumer balance sheets right now). Sitting atop this foundation of private sector balance sheet cash, we think M2 velocity is set to bounce sharply from its lowest level in history (see Figure 3), buoyed by rising sentiment in both the real and financial economies, as it appears the worst of the pandemic may well recede. Indeed, the equation of exchange suggests that a small mean-reversion in velocity, in light of the recent large increase in the monetary base, can create gaudy nominal growth outcomes over time.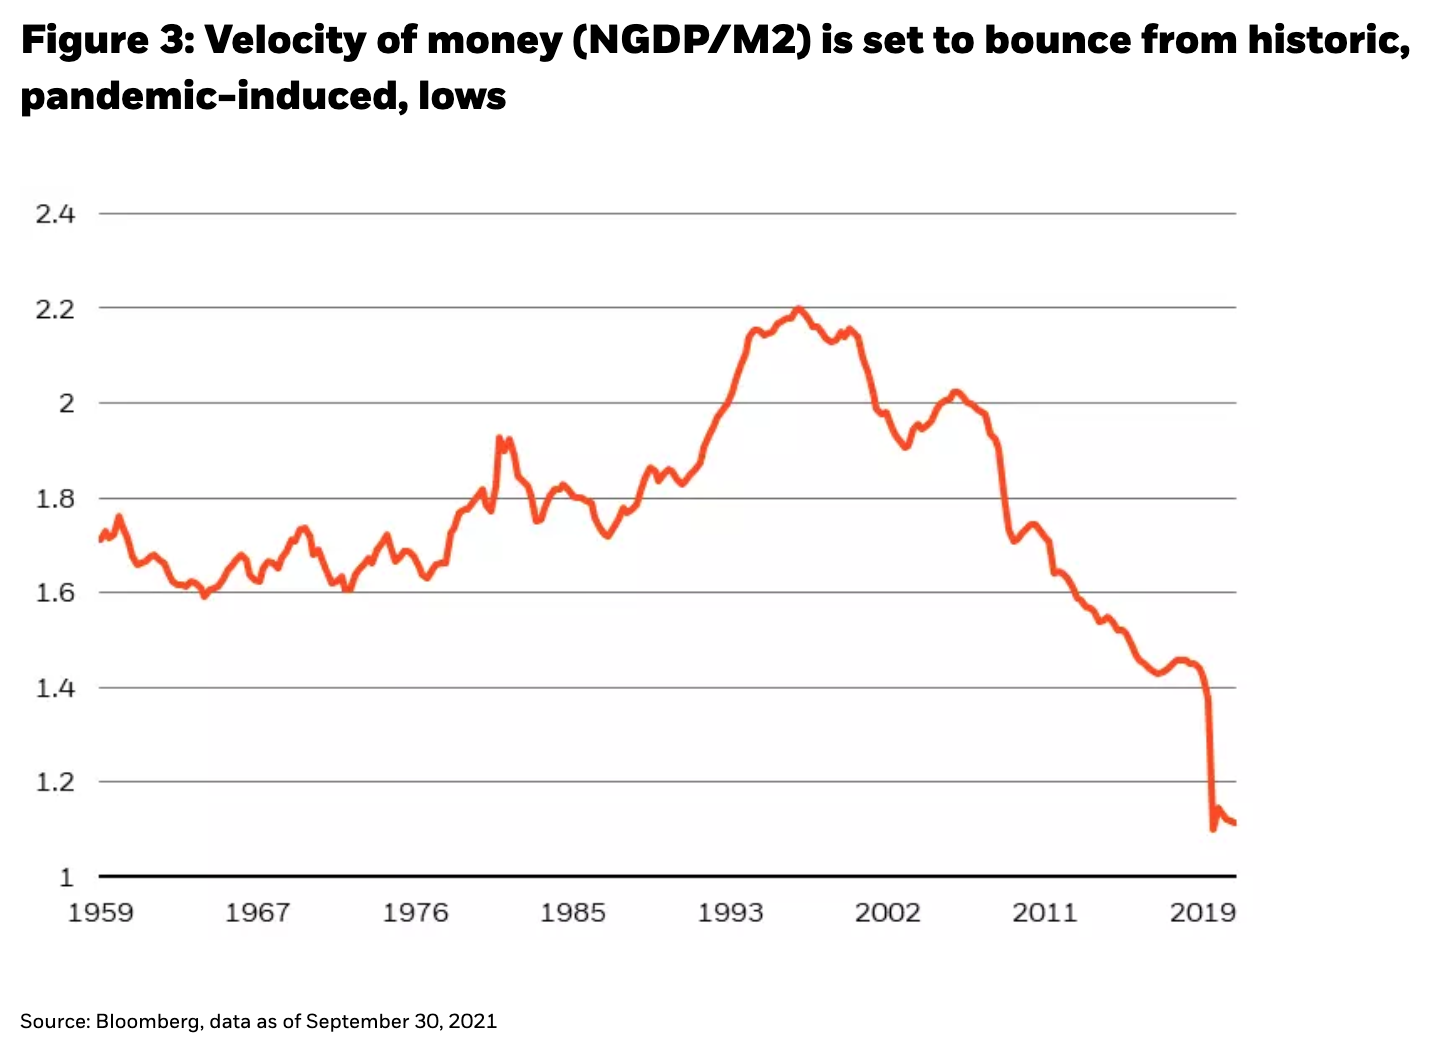 The return of velocity may have already begun as October was the first post-Covid month without any new excess savings (but cumulative savings remain around $2.5 trillion), and after an anemic 18 months for consumer and real estate loan growth, a $1.6 trillion gap in bank lending has developed. Therefore, there is ample space for credit creation to pick up the growth baton once QE ends in 2022, in our view. The surging economy is creating a virtuous cycle by driving historic increases in organic personal income growth and consumption, such that a return to pre-pandemic velocity would put a $40 trillion economy within the United States’ reach by 2025 (see Figure 4).
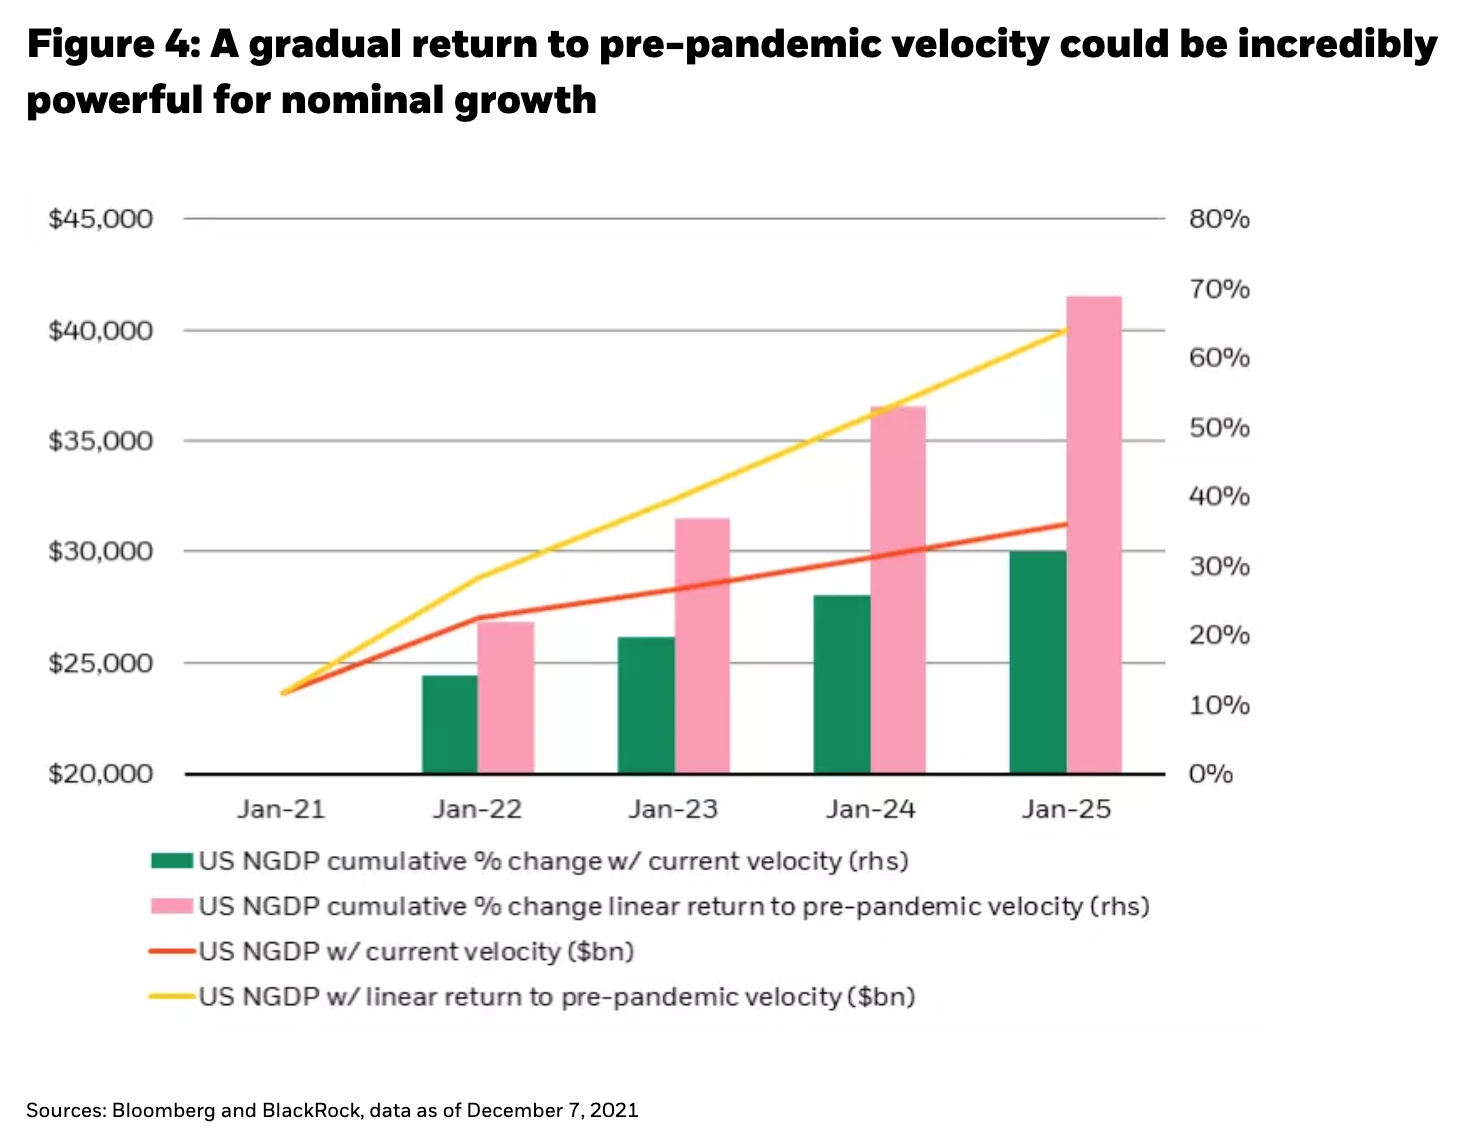
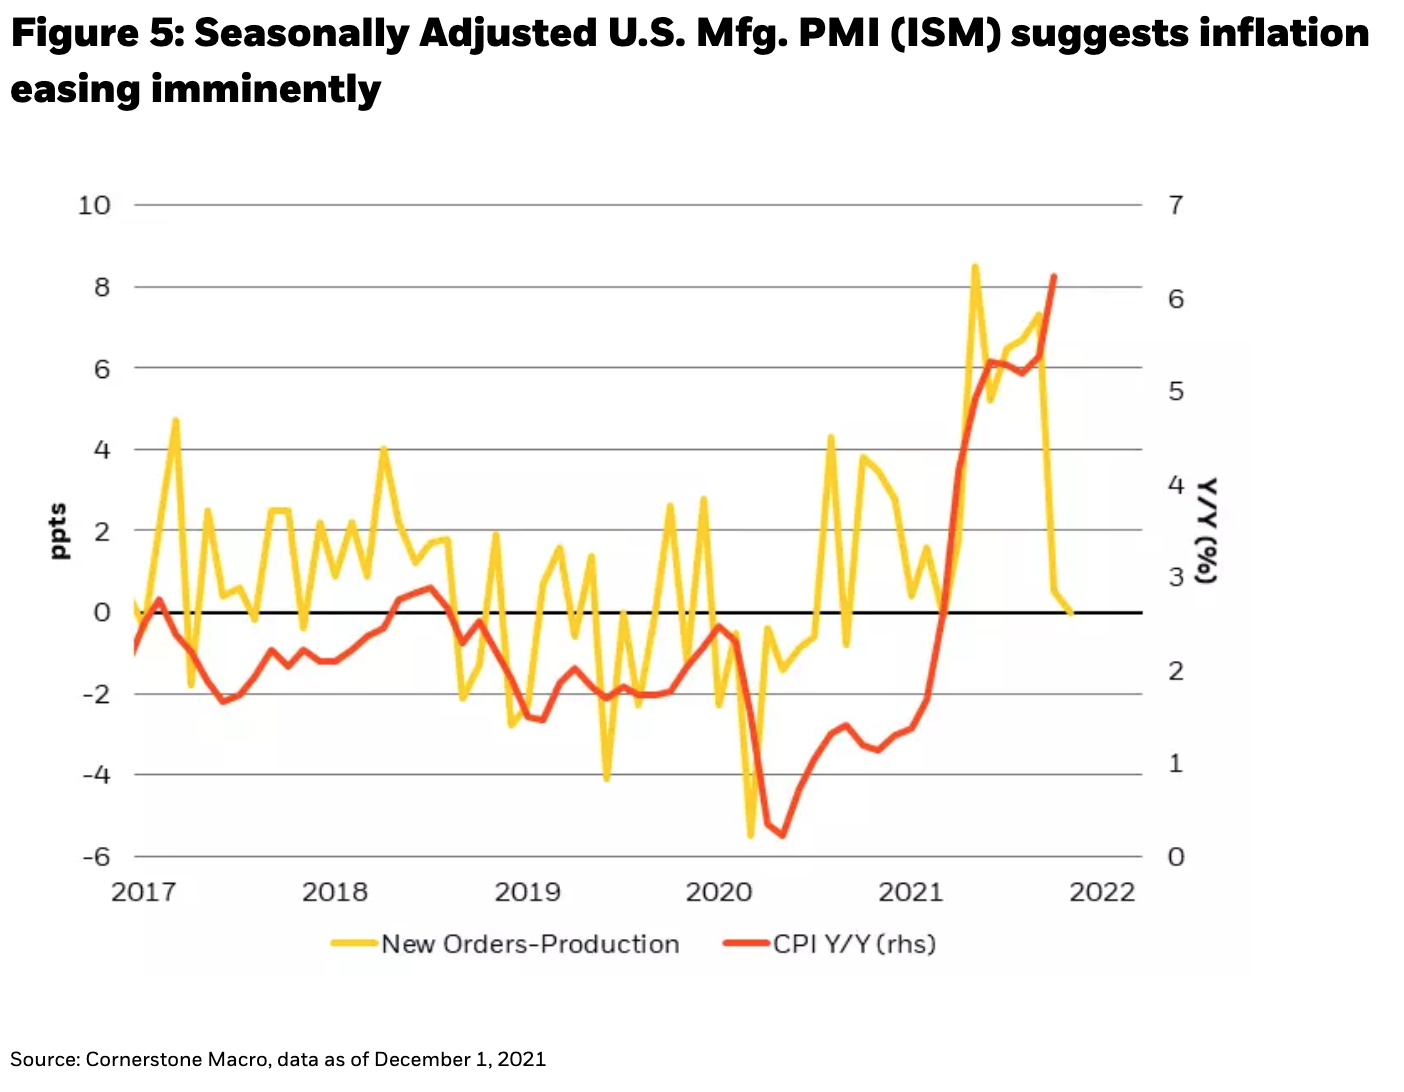
3) Inflation headlines stay worrisome until spring, when base-effects and other influences assuage fears
When it comes to prices across the broad economy, the next two months could look very different from the ten months after that. Early indicators, such as the spread between the ISM’s New Orders and Production indices, have fully closed, suggesting that headline inflation may soon moderate (see Figure 5). Further, supply chain-led inventory shortages tell a very distorted story across industries. In some sectors, inventories are growing rapidly, which could end up leading to price-reductions and/or promotion-enhanced sales this holiday season. Recent earnings reports from large corporations like Walmart, Target, Home Depot and Lowes, show inventories that are at multi-year highs, suggesting a decent ability to meet demand. In fact, it is only because demand is so exceptionally strong that would-be high inventories are being made to appear low, at least as chronicled by the media.
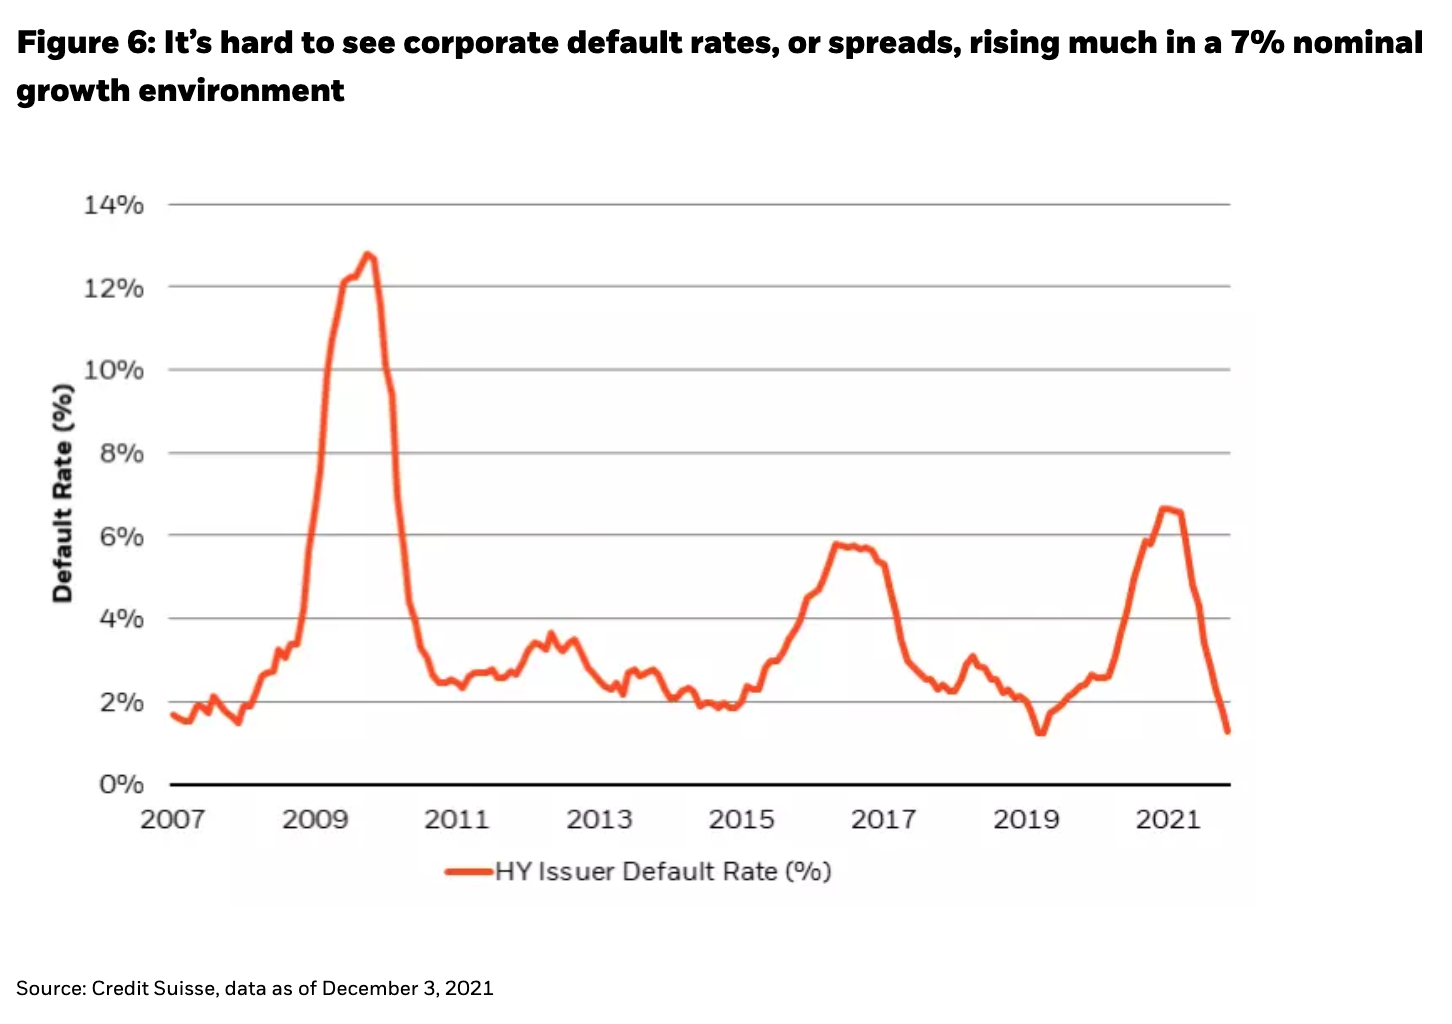
4) The Agg is not a fruitful return opportunity, but even with sticky-high inflation it isn’t very negative either
Demand for fixed income will continue to exceed expectations, holding yields in check even amid historically high inflation. That’s partly because pension funds are sitting on the highest funding status in almost two decades, prompting a reallocation out of risky assets and into risk-free securities, like long duration Treasury bonds. At the same time, nominal growth is also the highest in decades, driven by an immense stock of liquidity, meaning risky spreads can stay tighter for longer since corporate default fears can be kept at bay by rising earnings (see Figure 6). The U.S. Aggregate Index, a hybrid of both risk-free and risky assets, should rightfully back up next year, in sympathy with strong growth, so it’s hard to see a promising return coming from this index. Still, with both risk-free yields and risky spreads staying contained, due to other supporting factors, it’s also hard to see investors suffering a crippling loss there.
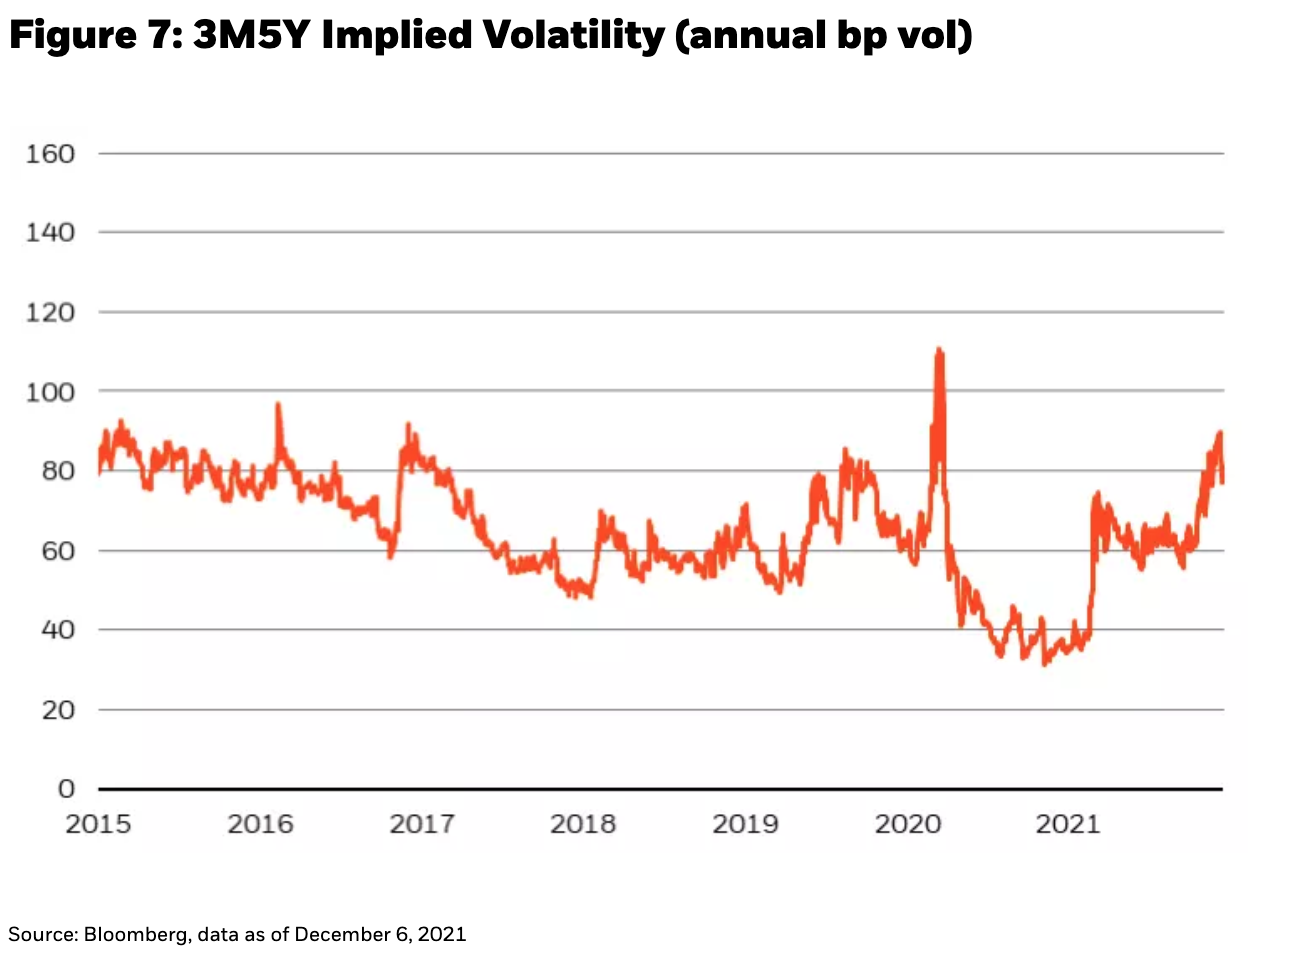
5) The 5-Year UST note stays in a +/- 25 bps range, after spending 2021 in a 100 bps range: Bulls and bears may both be better off selling elevated vol
We like buying volatility where it is cheap and selling it where it is rich. After a year in which the 5-year note has moved in a 100 basis point (bps) range, the options market is pricing forward moves to maintain this 80-to-100 bps pace (see Figure 7), making those options almost as expensive as in the aftermath of the 2016 U.S. election, or during the depths of the pandemic in March 2020. If rate vol is indeed responding to backward looking moves, it should be opportunistically sold. At the same time, we like owning convexity in the dollar, where volatility is much cheaper than in rates. For example, option prices in the Euro are only in their 24th percentile, whereas they are at the 100th percentile in the U.S. 2-year Treasury note. In our view, elevated volatility at the very front end may be justified, as it is the point at which policy acts, but it has pulled volatility in the rest of the curve higher along with it. The more normalization gets priced in at the front, the less likely it will be for the rest of the curve to spiral out of control.
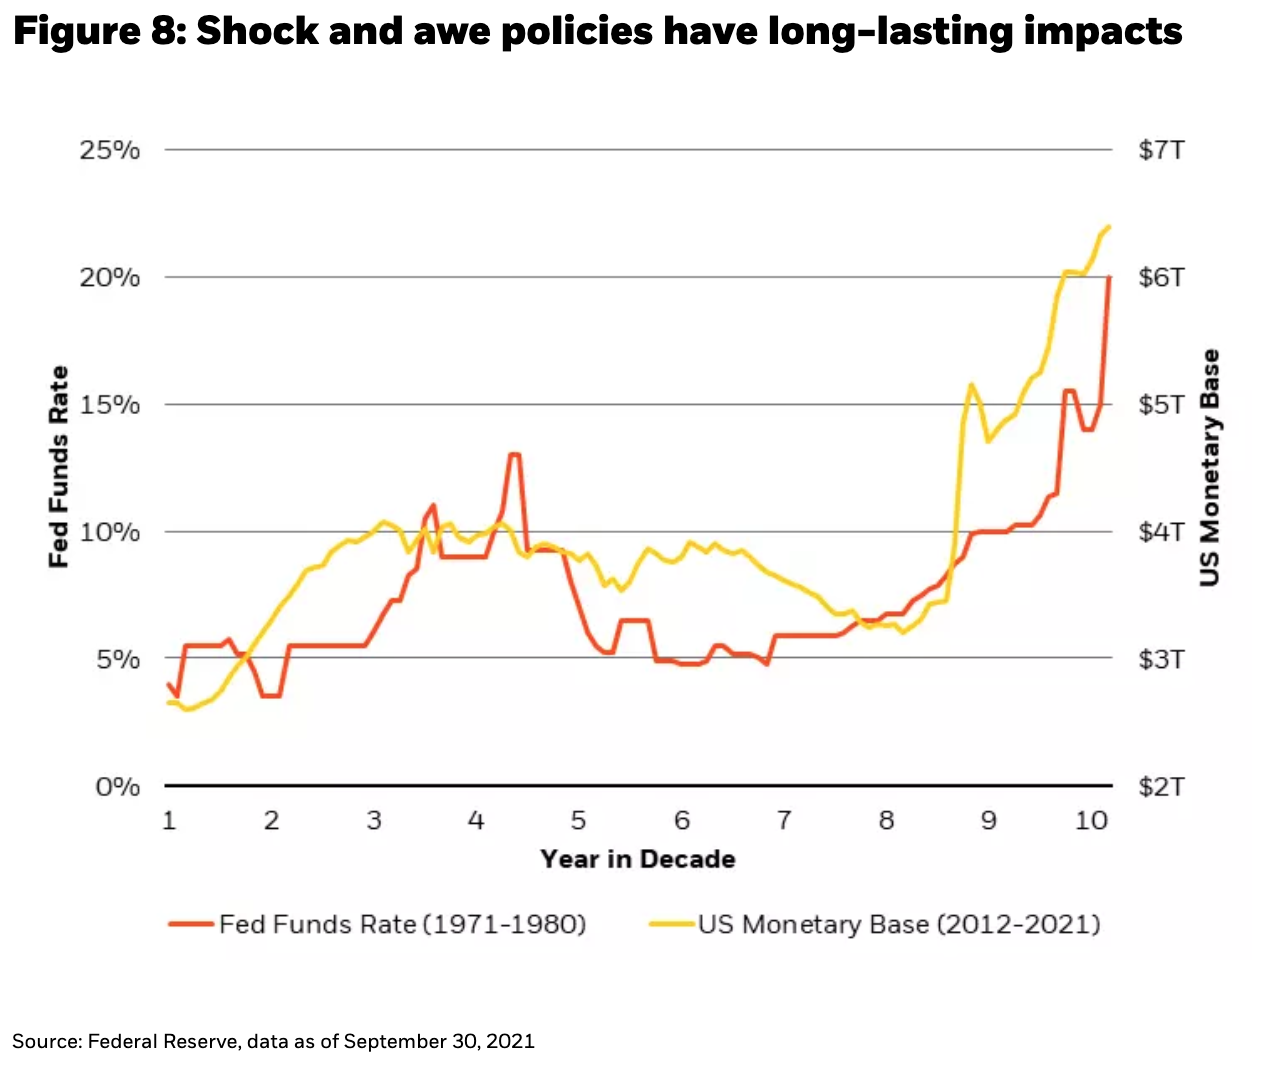
6) From great to good in equity returns in 2022
The liquidity injections of 2020-21 underpin a sticky high growth rate, or the “g” variable in the terminal value equation, as we wrote about in our recent commentary It’s Not the 1970s Again. Organic growth in 2022 will be enough for equity markets to post a decent return for the fourth consecutive year, but likely a lower return than the exceptional performance of the last few years. Too many market participants are focused on inflation, but if there’s a 1970s parallel that’s useful today, it’s how extreme policy actions can influence market returns for a long time (see Figure 8). In 1980, a high discount rate made the risk-free rate a superior investment for years afterward, and in 2021, the liquidity injections of the last two years will likely keep growth, and asset prices, high for several years hence. Indeed, the era of overt debt monetization in global developed markets has arrived, meaning that ongoing liquidity injections could potentially be a staple of policy coordination in the years ahead. The Federal Reserve is now by far the largest holder of U.S. Treasury debt (after financing pandemic stimulus), while Japan appears to have fully embraced an MMT-like approach as recently as last month as it embarks on a new round of monetized fiscal stimulus, amounting to about 10% of GDP (or as large as their pandemic stimulus to-date).
7) Dispersion in equities will likely grow significantly, not unlike a game of “Asteroids”
On November 26, 2021, S&P 500 e-mini futures hit one of their highest volumes in the month of November – an incredible feat given that the day in question was a half day, sandwiched between a national holiday and a weekend. At the same time, this enormous volume was funneled through some of the smallest “pipes” on record. Top-of-book depth was 47% below the year-to-date average, and a whopping 76% below the 5-year average. What this means is that marginal actions by market participants are having an extreme impact on price – such that buying and selling feels a bit like shooting at random asteroid patterns. And if marginal actions have had an outsized impact on indices, they’ve been having an enormous impact on sectors and individual stocks. We think this trend continues into 2022, just as liquidity starts to matter a little less, and fundamentals start to matter a little more. So, sector selection will be key, but also deciphering the dispersion within each sector will be required. Companies in the same sector can be quite different from a fundamental and thematic perspective – and returns in 2022 are likely to be revealing.
Follow Rick Rieder on Twitter
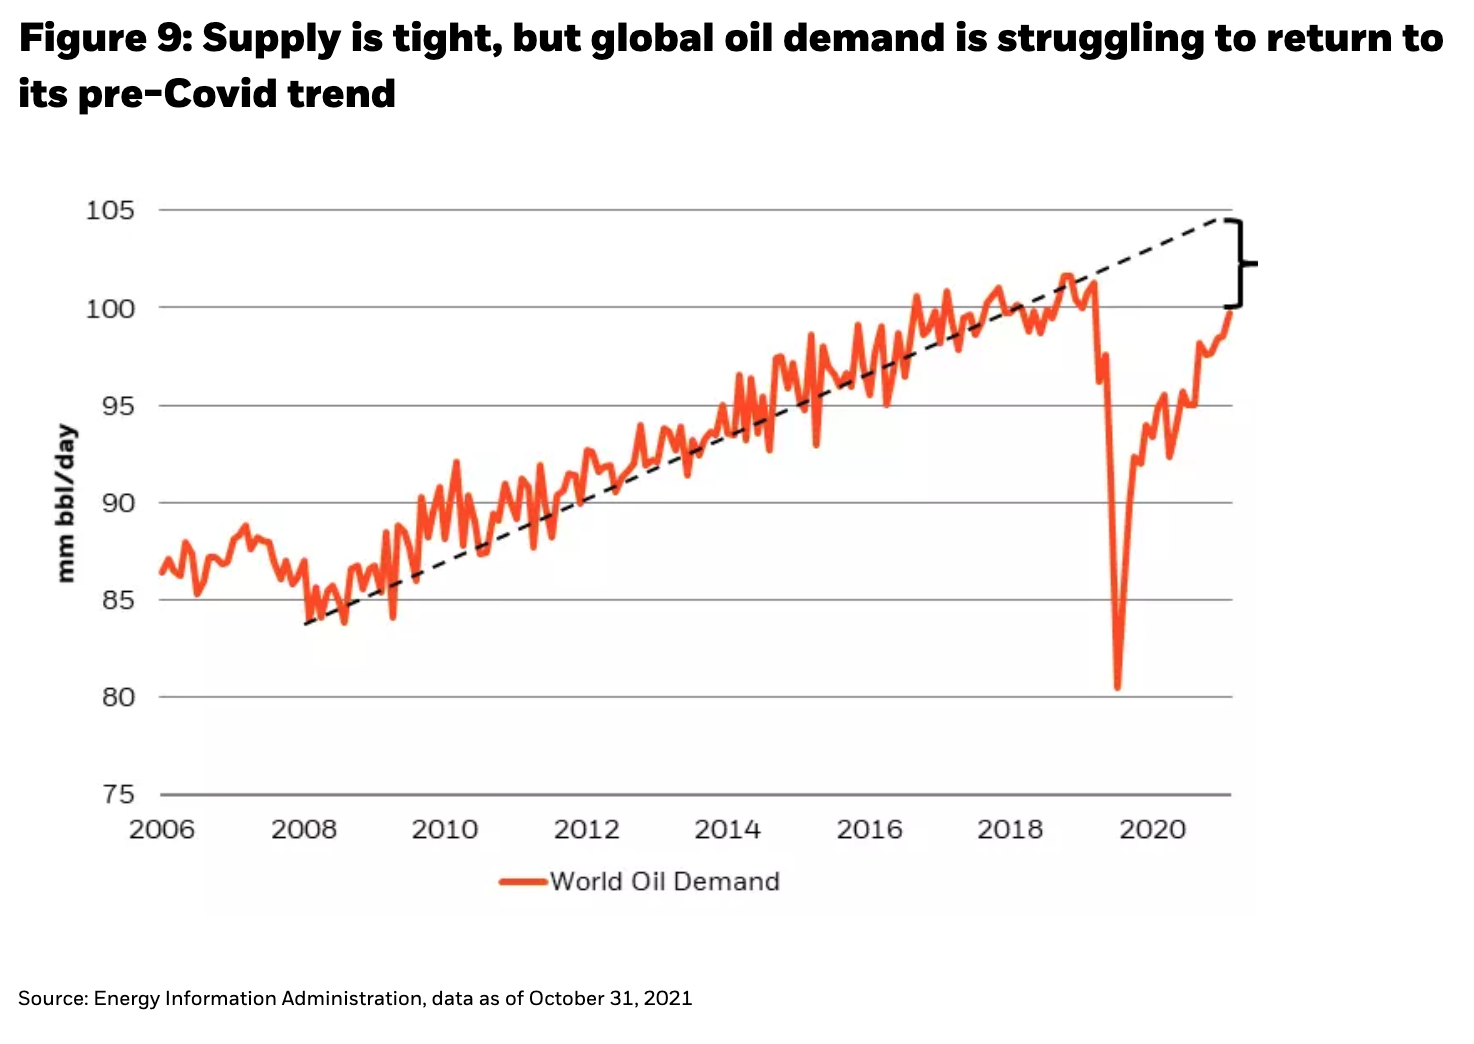
8) Divergence grows, but not in Oil – it averages >$70 for the first time in almost a decade
Energy prices are high, or at least higher than consumers have been used to in many years. Supporting prices into 2022 are inventories that are the lowest in five years, corporate capital expenditures that are at their lowest levels in 15 years, and spare capacity that is also relatively low. But spare capacity doesn’t need to be as high in a world that is unlikely to return to pre-Covid demand trends due to demand substitution (see Figure 9). The 1970s-style right tail in oil is capped by some structural forces, meaning energy prices aren’t likely to spiral out of control. We showed in a recent commentary (Halloween and Christmas for Markets) how the energy intensity of consumption has slowed, such that consumption, particularly in the form of retail sales, can continue displaying broad-based strength (as it has) without influencing, or being influenced by, oil prices.
9) We all need a little TLC – and investing around Tech, Lifesciences & Climate is structurally important
While global growth will be robust, parts of the tech sector are looking to grow exponentially over the next decade. Virtual reality, augmented reality, and the metaverse are going to be concepts that we hear more and more about, and in which early investors will be rewarded (see Figure 10). Technology continues to permeate the healthcare industry too: medical investment is set to soar in a post-Covid world. Last but not least, whether you believe in climate change or not, it’s going to be a secular investment theme and we’re undoubtedly going to continue to get some crazy weather to reinforce that theme. Staying in front of these structural forces is imperative, especially in the equity segment of the capital structure (less so in fixed income).

10) Whether it’s Taiwan or the Olympics, if you don’t have China on your radar, you’re not in the investment business
Investing in China is a question of where and when to invest, and of having some real patience for a while. The fact remains that China is still driving nearly a quarter of the world’s growth, even at lower growth rates. Economically, the country is investing in research and development (R&D) with an intensity that is comparable to developed market economies (see Figure 11), and investments in 5G and UHV technologies are set to grow 10x and 5x, respectively, by 2025. By the year 2024, China will also become the largest consumer of one of the world’s most intriguing commodities: data. Yet this economic representation is not matched in financial market indices – China is vastly underrepresented in global financial exposure relative to global economic exposure. We think capital flows will continue correcting that imbalance over the next few years.

11) Asset allocation will ditch the Efficient Market Theory and adopt an Adaptive Markets lens
Finance 101 teaches us that all stocks are perfectly priced to their inherent investment properties, the knowledge of which all market participants possess equally. The Efficient Market theory assumes it would be impossible to outperform the market and that all investors interpret available information in the same way. However, the last few weeks of Jekyll-and-Hyde price action, from indices to meme stocks to commodities like oil, suggests anything but efficient markets. Are investors really interpreting information the same way when a Tweet from Elon Musk referencing “use Signal” sends the wrong stock up 400%? As such, we think that asset allocation is increasingly going to be oriented around an adaptive markets framework (see Andrew Lo’s work, The Adaptive Markets Hypothesis, October 2004) rather than efficient markets, although the process of shifting mental paradigms can be slow. Ultimately, this may mean diversifying into “frontier” asset classes (just as investors diversified into emerging and frontier economies in the 2000s), such as real assets, commodities and even digital assets, effectively creating barbell portfolios. Innovation, even (or especially) in asset allocation, will be the key to achieving a consistent level of expected return.
Putting it all together: The Drive for 5 (% Return)
In 2022, we are optimistic about an astute investor’s ability to generate a 3% to 5% return in fixed income, despite the Aggregate index likely not straying too far from a flat return. The yields available in U.S. and European credit are not terribly far from being able to reach that 3% to 5% target, especially if one is willing to dip into high yield segments. Emerging market yields are even higher, at 5.7% (GBI-EM Index yield, as of December 3, 2021), but emerging market positions need to be sized appropriately, given their volatility. For anything beyond 5%, portfolios will likely have to look toward equities, which we think can produce a fourth consecutive year of double-digit returns (although this year’s 25% return in the S&P 500 may be hard to match), supported by durable earnings growth in an economy with one of the strongest fundamental backdrops since World War II.
 Rick RiederManaging DirectorRick Rieder, Managing Director, is BlackRock’s Chief Investment Officer of Global Fixed Income and is Head of the Global Allocation Investment Team.
Copyright © Blackrock