by Don Vialoux, EquityClock.com
Don Vialoux Presentation to CATA
A presentation will be made to members of the Canadian Association for Technical Analysis tomorrow evening (Tuesday at 8:00 PM EST). Topic: “Will Santa Claus come to Bay Street and Wall Street this year”? Not a member? Sign up at Canadian Association for Technical Analysis (canadianata.ca)
The Bottom Line
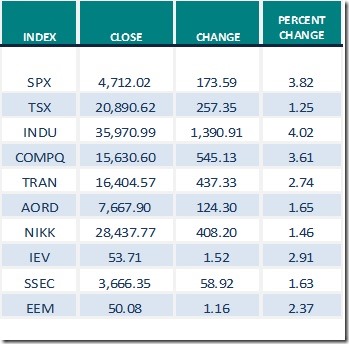
S&P 500 Index closed at an all-time closing high on Friday. Strength was recorded prior to the strongest three week period in the year for U.S. and Canadian equity markets from December 15th to January 6th, an encouraging technical sign.
The S&P 500 Index has advanced 74% of the time from December 15th to January 6th during the past 31 years. Average gain per period was 1.64%. The TSX Composite Index has advanced 87% of the time from December 15th to January 6th during the past 31 years. Average gain per period was 2.15%.
Caveat: The FOMC meets this Tuesday and Wednesday to determine U.S. monetary policy. Consensus calls for a tapering of monetary stimulus from November to mid-2022 by $15 billion per month from a peak of $120 billion per month. Completion of the program is scheduled for June 2022. If the FOMC announces plans to maintain its program as scheduled, equity markets are likely to continue to move higher into the December 15th to January 6th period. On the other hand, if the FOMC chooses to truncate the scheduled program significantly (mainly due to inflation pressures), U.S. equity markets probably will respond to the downside. Traders will watch closely for news from the FOMC meeting on Wednesday afternoon.
Observations
Short term short term indicators for U.S. equity indices and sectors (20 day moving averages, short term momentum indicators) moved higher last week.
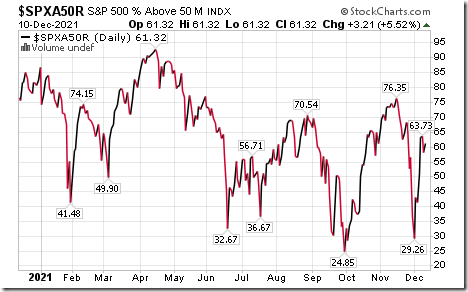
Intermediate term technical indicator for U.S. equity markets (Percent of S&P 500 stocks trading above their 50 day moving average) moved higher last week It changed from Neutral to Overbought. Trend is up. See Barometer chart at the end of this report.
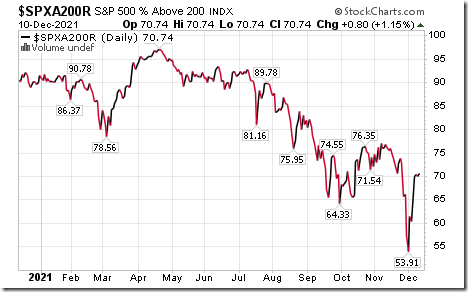
Long term technical indicator for U.S. equity markets (Percent of S&P 500 stocks trading above their 200 day moving average) moved higher last week. It remained Overbought. Trend turned higher. See Barometer chart at the end of this report.
Short term momentum indicators for Canadian indices and sectors moved higher last week.
Intermediate term technical indicator for Canadian equity markets remained Oversold last week despite recovering. Trend is up.. See Barometer chart at the end of this report.
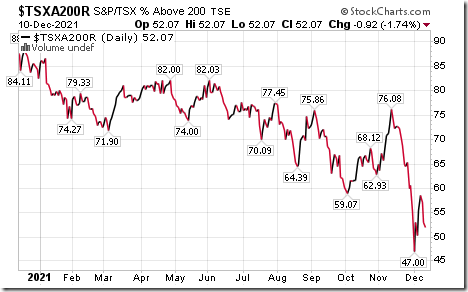
Long term technical indicator for Canadian equity markets (Percent of TSX stocks trading above their 200 day moving average) moved higher last week. It remained Neutral. Trend is up. See Barometer charts at the end of this report.
Consensus estimates for earnings and revenues in 2021 by S&P 500 companies were slightly higher from last week. According to www.FactSet.com earnings in the fourth quarter are projected to increase 21.1% (versus 20.9% last week) and revenues are projected to increase 12.7%. Earnings for all of 2021 are projected to increase 45.1% (versus 45.0% last week) and revenues are projected to increase 15.8% (versus 15.7 last week).
Consensus estimates for earnings and revenues in 2022 by S&P 500 companies also increased slightly. Consensus earnings on a year-over-year basis for the first quarter are projected to increase 6.0% (versus previous 5.9%) and revenues are expected to increase 9.4%. Earnings in the second quarter are expected to increase 3.9% (versus previous 3.7%) and revenues are expected to increase 7.2% (versus previous 7.3%). Consensus earnings in 2022 by S&P 500 companies are projected to increase 9.0% (versus previous 8.8%) and revenues are projected to increase7.3%.
Economic News This Week
November Producer Price Index to be released at 8:30 AM EST on Tuesday is expected to increase 0.5% versus a gain of 0.6% in October. Excluding food and energy, November Producer Price Index is expected to increase 0.4% versus a gain of 0.4% in October.
November Canadian Housing Starts to be released at 8:15 AM EST on Wednesday are expected to increase to 240,000 units from 236,600 units in October.
U.S. November Retail Sales to be released at 8:30 AM EST on Wednesday are expected to increase 0.8% versus a gain of 1.7% in October. Excluding auto sales, November Retail Sales are expected to increase 1.0% versus a gain of 1.7% in October.
December Empire State Manufacturing Survey to be released at 8:30 AM EST on Wednesday is expected to slip to 27.00 from 30.50 in November.
November Canadian Consumer Price Index to be released at 8:30 AM EST on Wednesday is expected to increase 0.7% versus a gain of 0.7% in October (Year-over-year, an increase of 4.7% versus a gain of 4.7% in October).
October U.S. Business Inventories to be released at 10:00 AM EST on Wednesday are expected to increase 0.9% versus a gain of 0.7% in September.
FOMC statement on interest rates to be released at 2:00 PM EST on Wednesday is expected to maintain the Fed Fund Rate at 0.25%. An update on tapering is expected. Press conference is held at 2:30 PM EST.
November U.S. Housing Starts to be released at 8:30 AM EST on Thursday are expected to increase to 1.565 million units from 1.520 million units in October.
December Philly Fed Index to be released at 8:30 AM EST on Thursday is expected to drop to 30.0 from 39.0 in November.
November U.S. Capacity Utilization to be released at 9:15 AM EST on Thursday is expected to increase to 76.7 from 76.4 in October. November Industrial Production is expected to increase 0.7% versus a gain of 1.6% in October.
Earnings News This Week
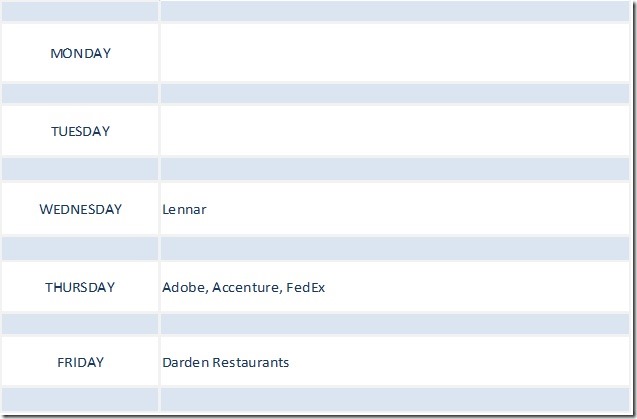
Five S&P 500 companies are scheduled to release quarterly earnings this week.
Trader’s Corner
Equity Indices and Related ETFs
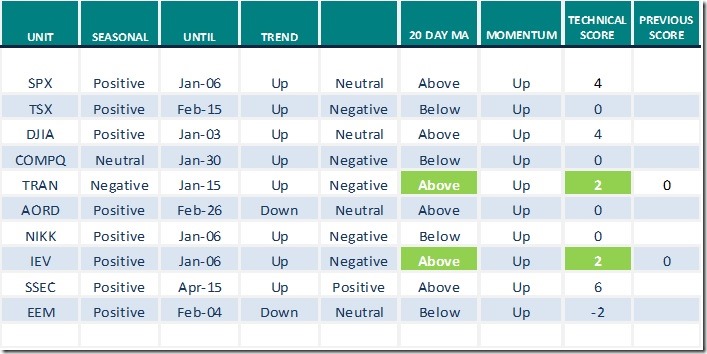
Daily Seasonal/Technical Equity Trends for Dec.10th 2021
Green: Increase from previous day
Red: Decrease from previous day
Commodities
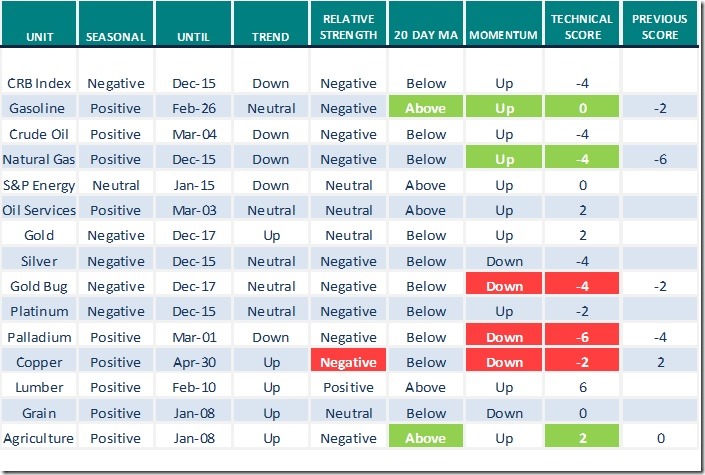
Daily Seasonal/Technical Commodities Trends for Dec.10th 2021
Green: Increase from previous day
Red: Decrease from previous day
Sectors
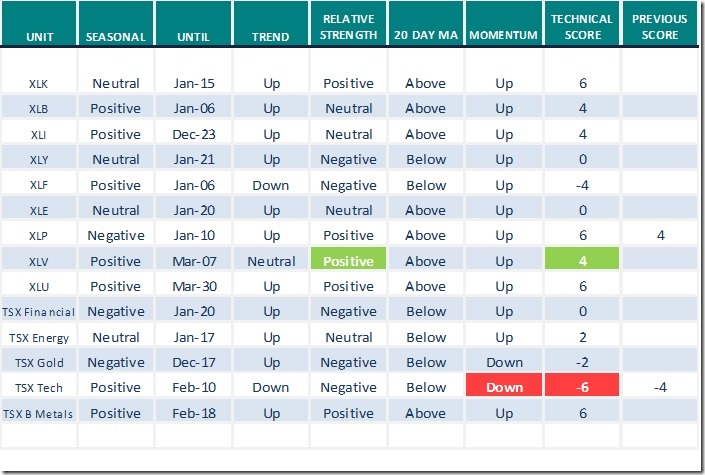
Daily Seasonal/Technical Sector Trends for Dec.10th 2021
Green: Increase from previous day
Red: Decrease from previous day
All seasonality ratings are based on performance relative to the S&P 500 Index (except TSX).
Links offered by valued providers
Michael Campbell’s Money Talks for December 11th 2021
December 11th Episode (mikesmoneytalks.ca)
Thank you to Mark Bunting and www.uncommonsenseinvestor.com for links to the following comments:
Insiders Selling at Record Pace While Extreme Speculation Continues – Uncommon Sense Investor
The 22 Best Stocks to Buy for 2022 | Kiplinger
Greg Schnell notes “These important names are just about ready”. Greg focuses on the big base metal mining stocks.
These Important Names are Just About Ready | ChartWatchers | StockCharts.com
Technical Scoop
Thank you to David Chapman and www.EnrichedInvesting.com for the link:
To be added
Mark Leibovit asks “Santa Claus rally ahead”? Following is a link:
https://www.howestreet.com/2021/12/santa-claus-rally-ahead-mark-leibovit/
Technical Scores
Calculated as follows:
Intermediate Uptrend based on at least 20 trading days: Score 2
(Higher highs and higher lows)
Intermediate Neutral trend: Score 0
(Not up or down)
Intermediate Downtrend: Score -2
(Lower highs and lower lows)
Outperformance relative to the S&P 500 Index: Score: 2
Neutral Performance relative to the S&P 500 Index: 0
Underperformance relative to the S&P 500 Index: Score –2
Above 20 day moving average: Score 1
At 20 day moving average: Score: 0
Below 20 day moving average: –1
Up trending momentum indicators (Daily Stochastics, RSI and MACD): 1
Mixed momentum indicators: 0
Down trending momentum indicators: –1
Technical scores range from -6 to +6. Technical buy signals based on the above guidelines start when a security advances to at least 0.0, but preferably 2.0 or higher. Technical sell/short signals start when a security descends to 0, but preferably -2.0 or lower.
Long positions require maintaining a technical score of -2.0 or higher. Conversely, a short position requires maintaining a technical score of +2.0 or lower
Changes Last Week
Technical Notes released on Friday at
It looks like the seasonal adjustment factor is once again providing a skewed look at the state of jobless claims in the US. Headlines point to a large drop in initial claims, placing the count at the lowest level in more than 50 years. The actual change was a jump of 63,680 to 280,665, representing the largest increase since last winter. $STUDY $MACRO #Economy #Employment
Today, we present our forecast for the broad equity market for the year ahead. equityclock.com/2021/12/09/… $SPX $SPY $ES_F $STUDY
Technology SPDRs $XLK moved above $174.25 to an all-time high extending an intermediate uptrend.
Consumer Staples SPDRs $XLP moved above $73.38 to an all-time high extending an intermediate uptrend.
Oracle $ORCL a NASDAQ 100 stock moved above $98.95 to an all-time high extending an intermediate uptrend. Responding to stronger than consensus fiscal second quarter results. Seasonal influences are favourable until mid-January. If a subscriber to EquityClock, see:
https://charts.equityclock.com/oracle-corporation-nasdaqorcl-seasonal-chart
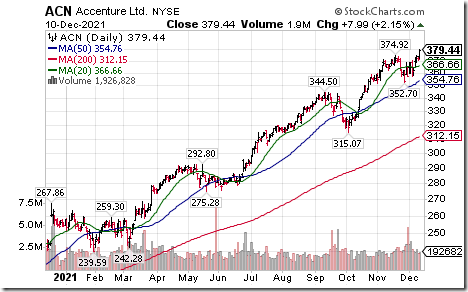
Accenture $ACN an S&P 100 stock moved above $374.92 to an all-time high extending an intermediate uptrend. Seasonal influences are favourable to late March. If a subscriber to EquityClock, see seasonality chart: https://charts.equityclock.com/accenture-ltd-nyseacn-seasonal-chart
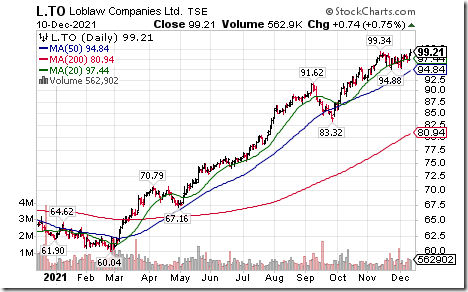
Loblaw Companies $L.CA a TSX 60 stock moved above Cdn$99.34 to an all-time high extending an intermediate uptrend.
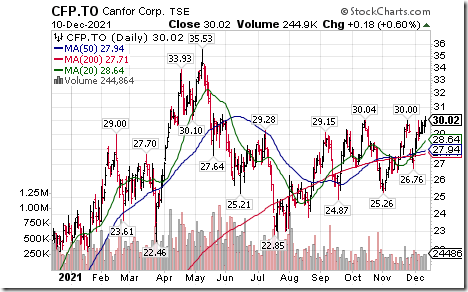
Forest product equities and ETFs (e.g. $WOOD $CUT ) continue to move higher with rising lumber prices. Canfor $CFP.CA a major Canadian producer moved above Cdn$30.04 extending an intermediate uptrend. Seasonal influences are strongly favourable to at least mid-February. If a subscriber to EquityClock, see: https://charts.equityclock.com/canfor-corporation-tsecfp-seasonal-chart
S&P 500 Momentum Barometers
The intermediate term Barometer added 3.21 on Friday and 19.84 last week to 61.32. It changed from Neutral to Overbought on Friday on a move above 60.00.
The long term Barometer added 0.80 on Friday and 10.42 last week. It remains Overbought.
TSX Momentum Barometers
The intermediate term Barometer slipped 1.38 on Friday, but added 12.33 last week. It remains Oversold and trending higher.
The long term Barometer slipped 0.92 on Friday, but added 1.61 last week. It remains Neutral.
Disclaimer: Seasonality and technical ratings offered in this report and at
www.equityclock.com are for information only. They should not be considered as advice to purchase or to sell mentioned securities. Data offered in this report is believed to be accurate, but is not guaranteed
This post was originally publised at Vialoux's Tech Talk.


