by Don Vialoux, EquityClock.com
The Bottom Line
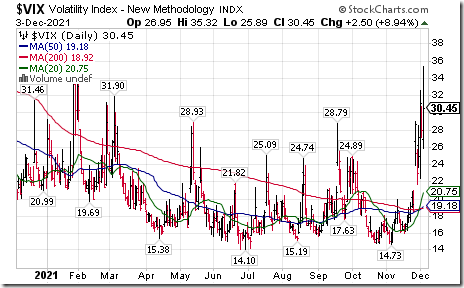
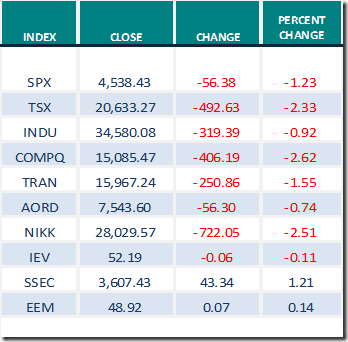
Extreme volatility was recorded by broadly based equity indices around the world last week. Concerns about a new COVID 19 variant took its toll. If history is used as a guide, North American equity markets have entered into a choppy period between now and December 14th followed by a the strongest three week period during the year from December 15th to January 6th
Observations
Short term short term indicators for U.S. equity indices and sectors (20 day moving averages, short term momentum indicators) moved lower again last week.
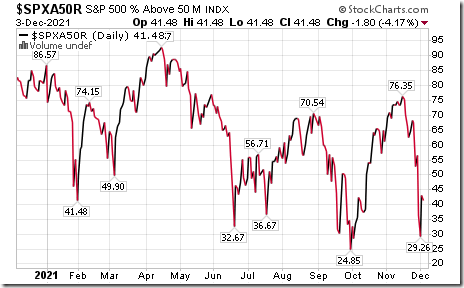
Intermediate term technical indicator for U.S. equity markets (Percent of S&P 500 stocks trading above their 50 day moving average) moved lower last week. It remained Neutral. Trend is down and has yet to show signs of bottoming. See Barometer chart at the end of this report.
Long term technical indicator for U.S. equity markets (Percent of S&P 500 stocks trading above their 200 day moving average) moved lower again last week. It remained Overbought. Trend remains down. See Barometer chart at the end of this report.
Short term momentum indicators for Canadian indices and sectors moved lower again last week.
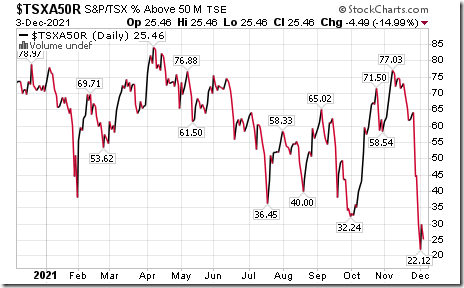
Intermediate term technical indicator for Canadian equity markets changed from Neutral to Oversold last week on a move below 40.00. Trend remains down and has yet to show signs of bottoming. See Barometer chart at the end of this report.
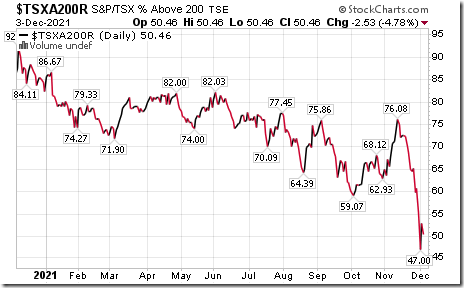
Long term technical indicator for Canadian equity markets (Percent of TSX stocks trading above their 200 day moving average) moved lower again last week. It remained Neutral. Trend remains down and has yet to show signs of bottoming. See Barometer charts at the end of this report.
Consensus estimates for earnings and revenues in 2021 by S&P 500 companies were virtually unchanged from two weeks ago. According to www.FactSet.com earnings in the fourth quarter are projected to increase 20.9% (versus 21.1% two weeks ago) and revenues are projected to increase 12.7% (versus 12.6% two weeks ago). Earnings for all of 2021 are projected to increase 45.0% (versus 44.9% two weeks ago) and revenues are projected to increase 15.7% (versus 15.8 two weeks ago).
Consensus estimates for earnings and revenues in 2022 by S&P 500 companies also were virtually unchanged from two weeks ago. Consensus earnings on a year-over-year basis for the first quarter are projected to increase 5.9% (versus previous 5.6%) and revenues are expected to increase 9.4% (versus previous 9.3%). Earnings in the second quarter are expected to increase 3.7% (versus previous 3.8%) and revenues are expected to increase 7.3% (versus previous 7.2%). Consensus earnings in 2022 by S&P 500 companies are projected to increase 8.8% (versus previous 8.7%) and revenues are projected to increase7.3% (versus previous 7.1%).
Economic News This Week
Third quarter U.S. Nonfarm Productivity to be released at 8:30 AM EST on Tuesday is expected to decline 4.9% versus a decline of 5.0% in the second quarter.
October U.S. Trade Deficit to be released at 8:30 AM EST on Tuesday is expected to improve to $67.50 billion from $80.90 billion in September
Canadian October Merchandise Trade Balance to be released at 8:30 AM EST on Tuesday is expected to slip to +$1.55 billion from +$1.86 billion in September.
Bank of Canada’s statement on interest rates is released at 10:00 AM EST on Wednesday. Overnight lending rate to major banks is expected to remain unchanged at 0.25%.
November U.S. Consumer Price Index to be released at 8:30 AM EST on Friday is expected to increase 0.7$ versus a gain of 0.9% in October. Excluding food and energy, November U.S. Consumer Price Index is expected to increase 0.5% versus a gain of 0.6% in October.
December Michigan Consumer Sentiment to be released at 10:00 AM EST on Friday is expected to slip to 67.0 from 67.4 in November.
Selected Earnings News This Week
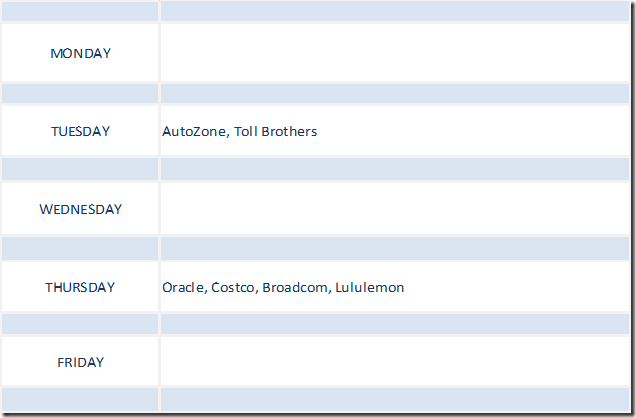
Six S&P 500 companies are scheduled to report quarterly results this week. No TSX 60 companies are scheduled to report.
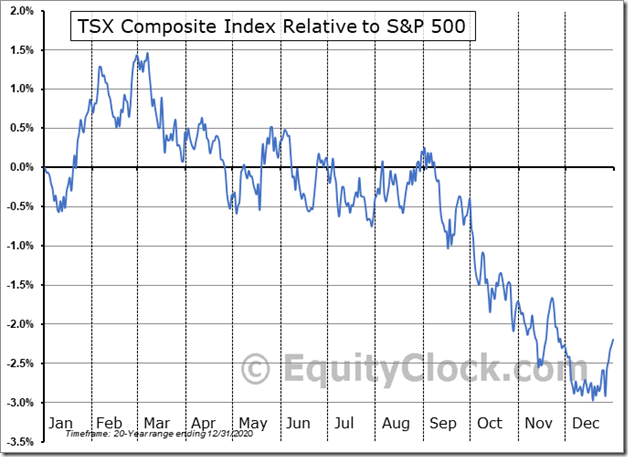
The TSX Composite Index has a history of outperforming the S&P 500 Index between now and the beginning of March. Funds for additional equity investments come partially from individuals who contribute into TSFAs and RRSP following receipts of year-end bonuses. A media comment this weekend predicted that year-end bonuses to bank employees will be 18% higher this year than last year.
Trader’s Corner
Equity Indices and Related ETFs
Daily Seasonal/Technical Equity Trends for Dec.3rd 2021
Green: Increase from previous day
Red: Decrease from previous day
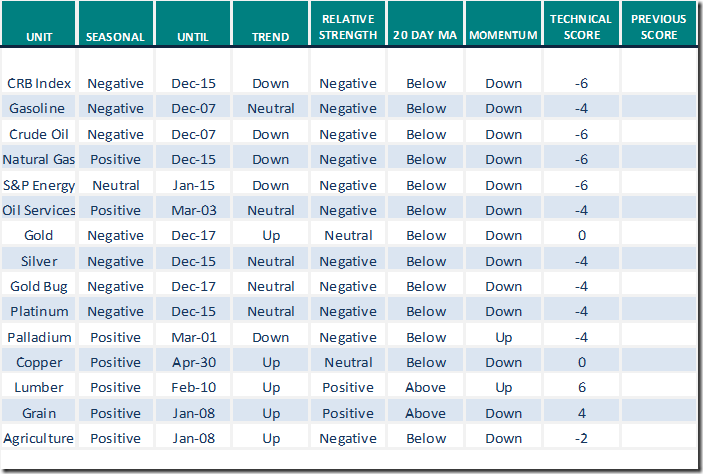
Commodities
Daily Seasonal/Technical Commodities Trends for Dec.3rd 2021
Green: Increase from previous day
Red: Decrease from previous day
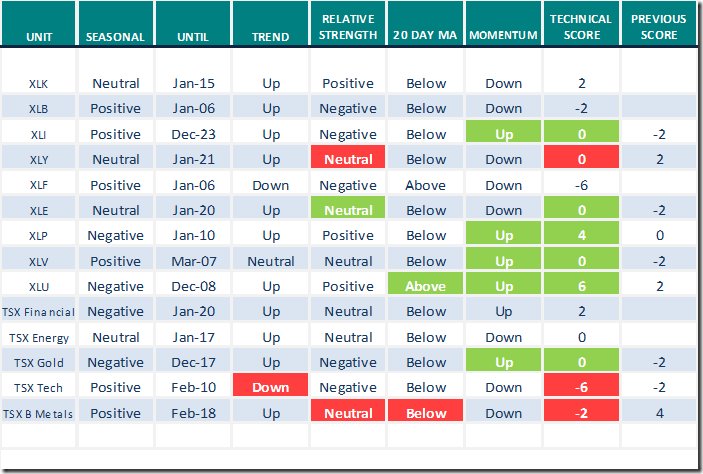
Sectors
Daily Seasonal/Technical Sector Trends for Dec.3rd 2021
Green: Increase from previous day
Red: Decrease from previous day
All seasonality ratings are based on performance relative to the S&P 500 Index (except TSX).
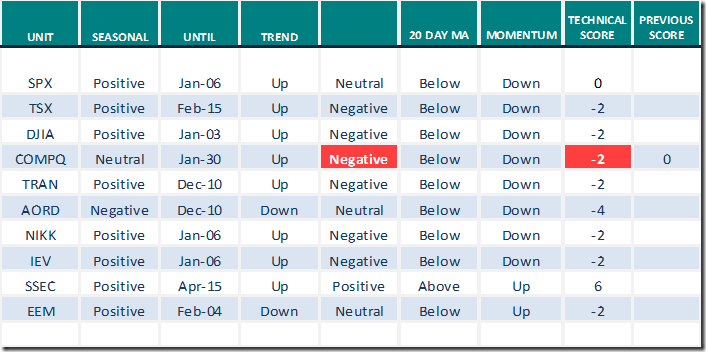
Technical Scores
Calculated as follows:
Intermediate Uptrend based on at least 20 trading days: Score 2
(Higher highs and higher lows)
Intermediate Neutral trend: Score 0
(Not up or down)
Intermediate Downtrend: Score -2
(Lower highs and lower lows)
Outperformance relative to the S&P 500 Index: Score: 2
Neutral Performance relative to the S&P 500 Index: 0
Underperformance relative to the S&P 500 Index: Score –2
Above 20 day moving average: Score 1
At 20 day moving average: Score: 0
Below 20 day moving average: –1
Up trending momentum indicators (Daily Stochastics, RSI and MACD): 1
Mixed momentum indicators: 0
Down trending momentum indicators: –1
Technical scores range from -6 to +6. Technical buy signals based on the above guidelines start when a security advances to at least 0.0, but preferably 2.0 or higher. Technical sell/short signals start when a security descends to 0, but preferably -2.0 or lower.
Long positions require maintaining a technical score of -2.0 or higher. Conversely, a short position requires maintaining a technical score of +2.0 or lower
Changes Last Week
Technical Notes released on Friday at
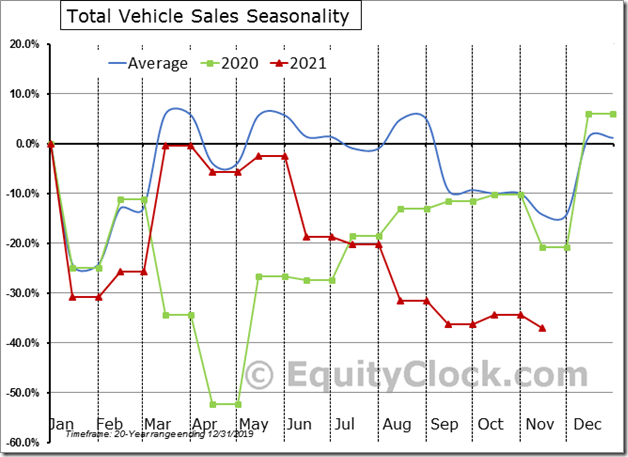
The trend of vehicle sales is slowly normalizing as supply-chain bottlenecks alleviate, but there is substantial progress that is required. equityclock.com/2021/12/02/… $STUDY $MACRO $CARZ $GM $F $TM $TSLA
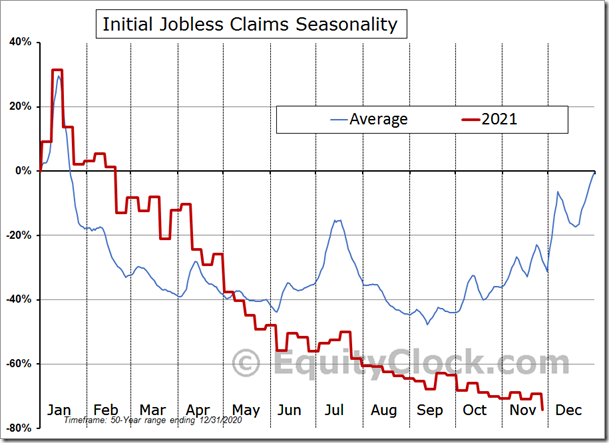
The negative divergence recorded in jobless claims over the past month points to another stronger than average payroll report when the numbers are released on Friday morning. $STUDY $MACRO #Economy #Employment #NFP
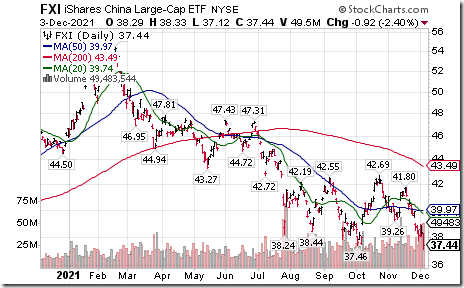
China large cap iShares $FXI moved below $37.46 extending an intermediate downtrend.
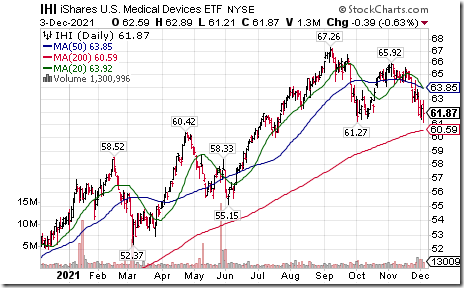
Medical Devices iShares $IHI moved below $61.27 completing a double top pattern.
Biotech ETF $BBH moved below $187.63 extending an intermediate downtrend.
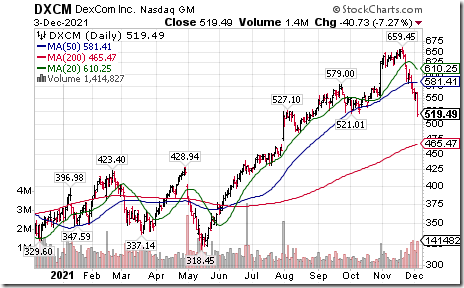
DexCom $DXCM a NASDAQ 100 stock moved below 4521.01 extending an intermediate downtrend.
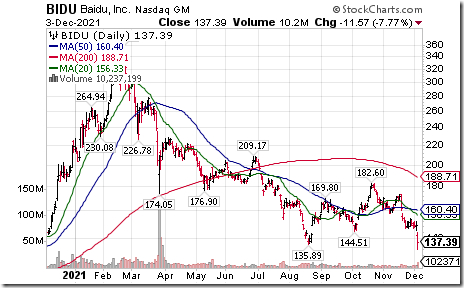
Baidu $BIDU a NASDAQ 100 stock moved below $135.89 extending an intermediate downtrend.
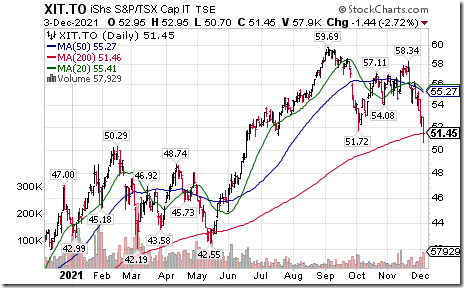
Canadian Technology iShares $XIT.CA moved below $51.72 completing a double top pattern.
Links offered by Valued Providers
Comments by Mark Leibovit on HoweStreet
Why Statements from the Fed Lack Credibility – HoweStreet
Michael Campbell’s Money Talks for Saturday December 4th
December 4th Episode (mikesmoneytalks.ca)
Martin Pring says”Bullish Two-Bar Reversal Patterns Suggest a Temporary Bottom for Some Sectors”.
David Keller asks “Is the spike in volatility bearish for stocks”?
Spike in Volatility Bearish for Stocks? | The Mindful Investor | StockCharts.com
Thank you to Mark Bunting and www.uncommonsenseinvestor.com for links to the following comments:
Three Canadian Focus List Stocks For 2022 – Uncommon Sense Investor
Three Reasons the Market Has Bottomed & Will Rally Into Year-End – Uncommon Sense Investor
12 Best Materials Stocks to Buy for 2022 | Kiplinger
Thank you to David Chapman and www.enrichedinvesting.com for the link to Technical Scoop
Talking Points used for the Wolf on Bay Street Interview
Released on Saturday on HiFi Radio on Global News Radio 640 Toronto
World equity markets were rocked during the past 10 days by news of the COVID 19 Omicron variant. The sell-off occurred just after equity indices in North American equity markets reached all-time highs and were technically overbought. Since then, the Dow Jones Industrial Average and S&P 500 Index has dropped about 5% and the TSX Composite Index has dropped 6%. Technically, North American equity prices quickly moved from intermediate overbought to intermediate oversold. Technical signs of an intermediate low have yet to be identified.
Weakness comes at an important time for investors who are considering transactions for tax purposes before the end of the year. Most investors have recorded exceptional capital gains in 2021 despite recent weakness in equity prices. Only a few sectors currently are potential tax loss candidates due to their price decline in 2021. These sectors include precious metals stocks, Chinese stocks and cannabis stocks. A word of caution! When tax loss selling pressures abate (traditionally by mid-December), these sectors could recover significantly.
Traditionally, December has been a month of transition for North American equity indices. The first two weeks of December have a history of recording higher than average volatility with little or no gain. Investors are focussing on by year-end transactions for tax purposes. Thereafter, North American equity markets enter their strongest three week period in the year from December 14th to January 6th. This period is better known as “The Santa Claus Rally” period. Since 1990, the S&P 500 Index has gained 74% of the time and the TSX Composite Index has advanced 87% of the time. Reasons for strength include the following:
· Consumers are in a good mood for the holiday
· Employees receive year-end bonuses that partially are investing in equity markets
· Tax loss selling pressures prior to year-end have passed their peak
· Institutional activity is diminished as traders take holidays and retail investors have a greater influence.
· Investment dealers release bullish year-end reports highlighting the best investment opportunities for the next year.
A caveat for strength in equity markets during the current December 14th to January 6th period! The U.S. Federal Reserve’s next meeting to determine U.S. monetary policy is scheduled on December 14th and December 15th. Last Tuesday the Federal Reserve chairman Powell hinted that the Fed may reduce its monetary stimulus plan by beginning to reduce its purchases of government fixed income securities earlier than planned. If the Federal Reserve moves to reduce monetary stimulus, North American equity markets could have downside risk. However, the Federal Reserve probably will not want to be “The Grinch That Stole Christmas” and likely will not change policy at this meeting.
What sectors are likely to outperform equity markets between now and early next year?
1. Sectors that will benefit from the recently passed $1.1 trillion U.S. infrastructure program approved by Congress. Sectors include industrial companies receiving contracts to build infrastructure and companies providing materials used in the infrastructure program (e.g. base metals, steel, lumber).
2. Sectors that will benefit from a recovery by economies in the Far East (notably China). Sectors include companies producing base metals, lumber and agriculture products. The Chinese economy is expected to be bolstered by plans to prepare and host the Winter Olympic Games in Beijing in February.
Notable equities and ETFs that are top investment candidates to hold into early 2022 include:
· Forest products equities and ETFs: ETFs include WOOD and CUT
· Base metal equities and ETFs: ETFs include XBM.TO, PICK, COPX, XME
· Agriculture equities and ETFs: MOO, COW.TO
And one more! The recovery by North American economies has prompted a strong increase in inflation pressures. The Consumer Price Index in the U.S. recently jumped to 6.2% on a year-over-year basis in October. In Canada, the Consumer Price Index advanced by 4.7%.Ppassage of a $1.1 trillion infrastructure bill in the U.S. last month is adding to inflation pressures. Inflation pressures will accelerate if President Biden’s “Build Back Better” bill valued at an additional $1.9 trillion if approved by Congress. Since August, rising consumer prices have prompted the price of precious metals and related equities to recover slightly from oversold levels Massive new government spending programs will accelerate inflation pressures and add to the outlook for precious metals and related equities
Precious metals and related stocks could move higher for another reason: ‘Tis the season for precious metals prices and related equity prices to move higher from mid-December to the end of February. Strength is related to the production and sale of precious metal jewelry in China for gifts exchanged during the Chinese New Year’s. In 2022, Chinese New Year is celebrated on February 1st.
The easiest way for Canadians to participate in the gold sector is through a gold equity ETF (e.g.XGD.TO). Any weakness by the sector between now and mid-December will provide a buying opportunity.
S&P 500 Momentum Barometers
The intermediate term Barometer slipped 1.80 on Friday and fell 11.23 last week to 41.48. It remains Neutral and trending down.
The long term Barometer eased 1.20 on Friday and 5.41 last week to 60.32. It remains Overbought and trending down.
TSX Momentum Barometers
The intermediate Barometer slipped 4.49 on Friday and 19.24 last week to 25.45. It changed from Neutral to Oversold on a drop below 40.00. Trend remains down and has yet to show signs of bottoming.
The long term Barometer slipped 2.53 on Friday and 9.45 last week to 50.46. It remains Neutral and trending down.
Disclaimer: Seasonality and technical ratings offered in this report and at
www.equityclock.com are for information only. They should not be considered as advice to purchase or to sell mentioned securities. Data offered in this report is believed to be accurate, but is not guaranteed
This post was originally publised at Vialoux's Tech Talk.


