by Don Vialoux, EquityClock.com
Technical Notes released yesterday at
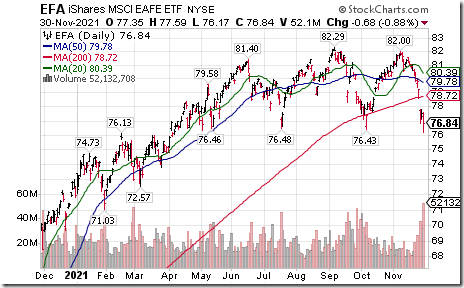
EAFE iShares $EFA moved below $76.43 completing a Head & Shoulders pattern
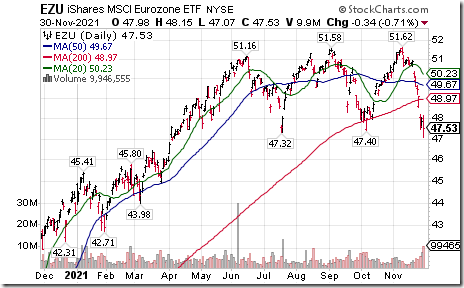
Eurozone iShares $EZU moved below $47.32 and $47.40 completing a triple top pattern
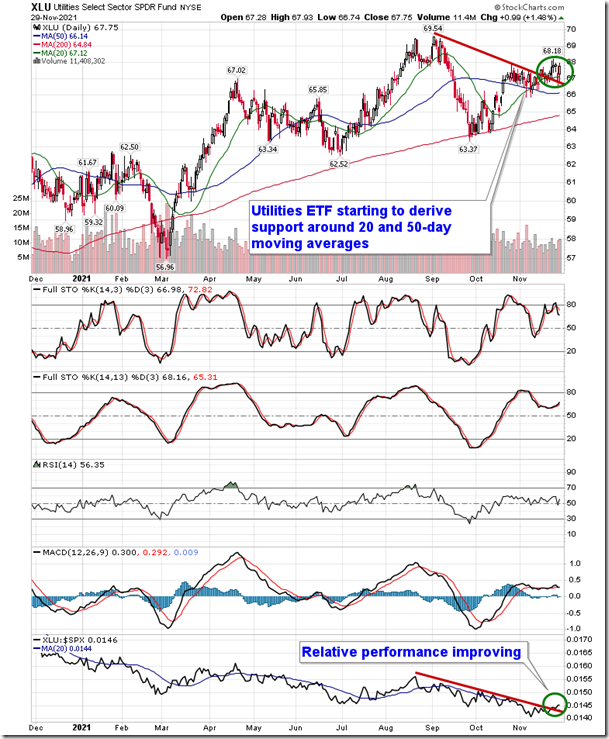
Defensive sectors receiving much of the benefit of the Omicron rebound, hinting that concerns pertaining to the spread of the virus persist. equityclock.com/2021/11/29/… $XLU $IYR $XLK
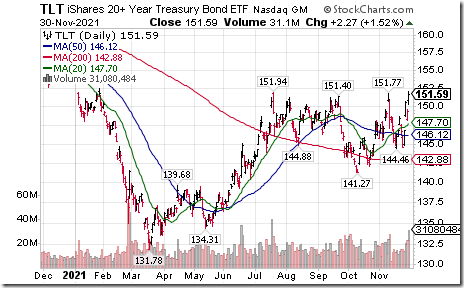
Long term governments bonds (20+years) $TLT moved above $151.94 resuming an intermediate uptrend.
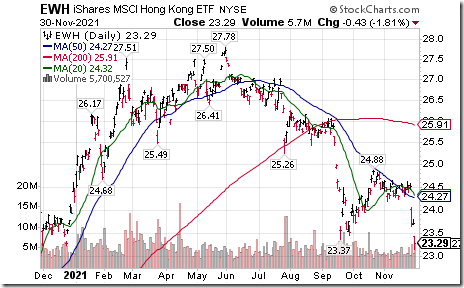
Hong Kong iShares $EWH moved below $23.37 extending an intermediate downtrend.
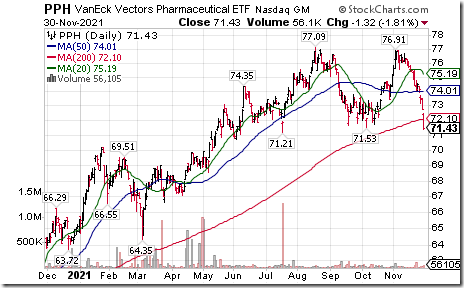
Pharma ETF $PPH moved below $71.53 completing a double top pattern.
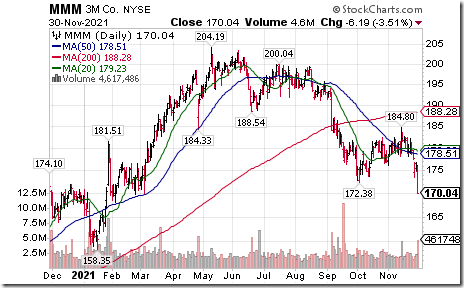
MMM $MMM a Dow Jones Industrial Average stock moved below $172.38 extending an intermediate downtrend.
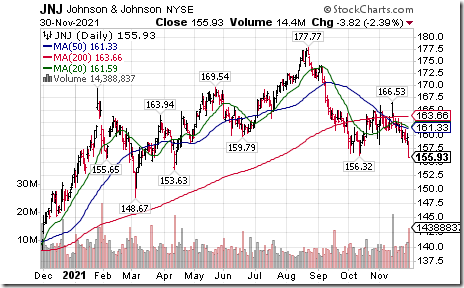
Johnson & Johnson $JNJ a Dow Jones Industrial Average stock moved below $156.32 completing a Head & Shoulders pattern
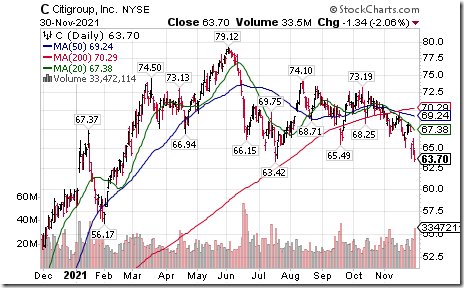
Citigroup $C an S&P 100 stock moved below $63.42 extending an intermediate downtrend.
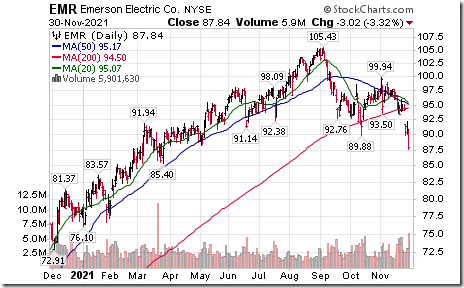
Emerson Electric $EMR an S&P 100 stock moved below $89.88 completing a Head & Shoulders pattern.
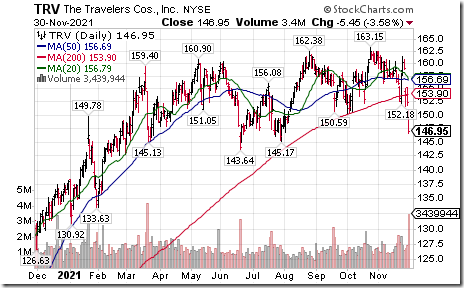
Travelers $TRV a Dow Jones Industrial Average stock moved below $150.59 completing a double top pattern.
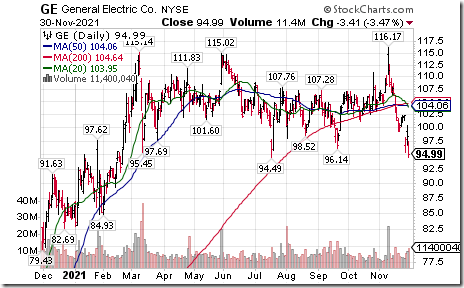
General Electric $GE an S&P 100 stock moved below $94.49 setting an intermediate downtrend.
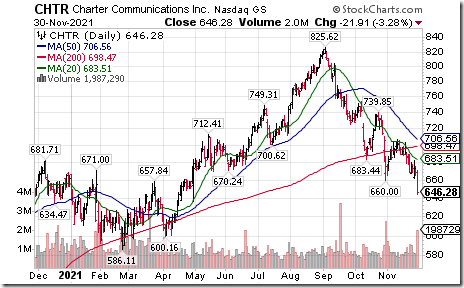
Charter Communications $CHTR a NASDAQ 100 stock moved below $660.00 extending an intermediate downtrend.
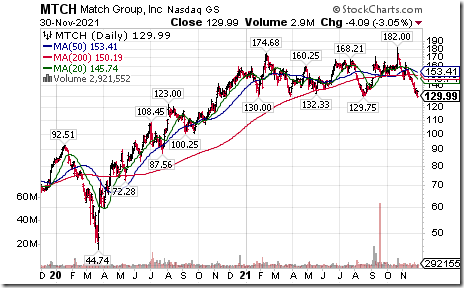
Match $MTCH a NASDAQ 100 stock moved below $129.75 completing a double top pattern
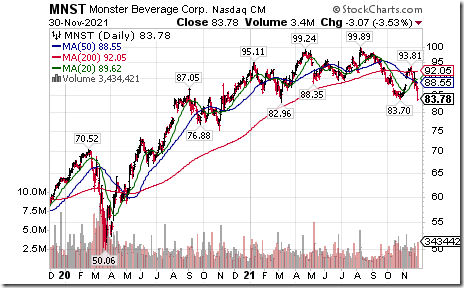
Monster Beverages $MNST a NASDAQ 100 stock moved below $83.70 extending an intermediate downtrend
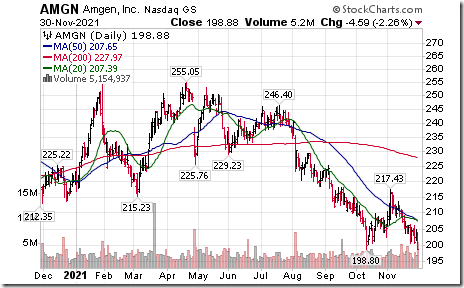
Amgen $AMGN an S&P 100 stock moved below $196.80 extending an intermediate downtrend.
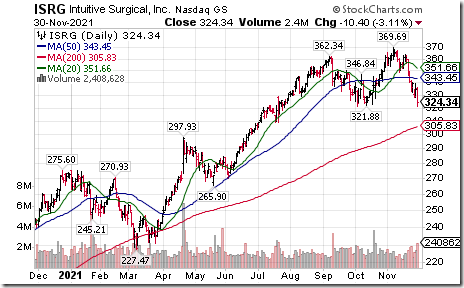
Intuit Surgical $ISRG a NASDAQ 100 stock moved below $321.88 completing a double top pattern.
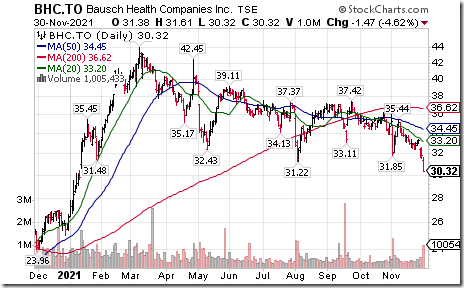
Bausch Health $BHC.CA a TSX 60 stock moved below Cdn$31.22 extending an intermediate downtrend.
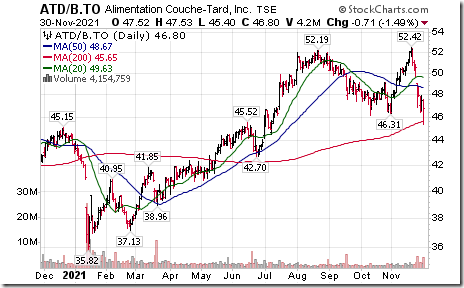
Couche Tard $ATD.B.CA a TSX 60 stock moved below $46.15 completing a double top pattern
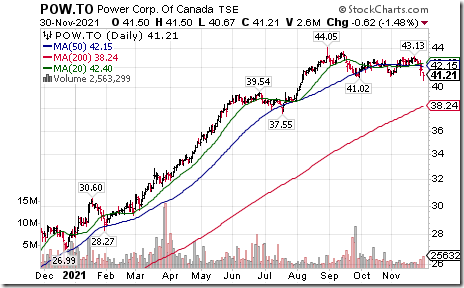
Power Corp $POW.CA a TSX 60 stock moved below $41.02 completing a double top pattern.
Trader’s Corner
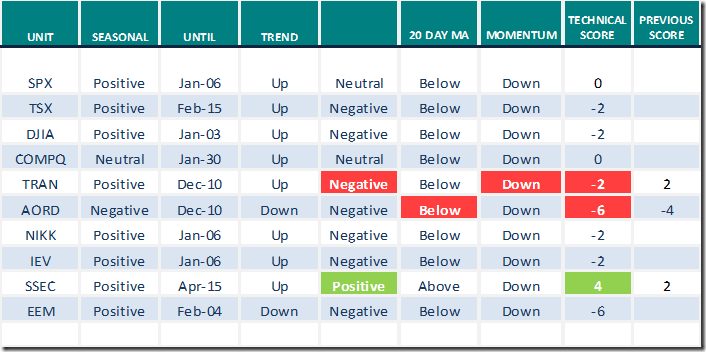
Equity Indices and Related ETFs
Daily Seasonal/Technical Equity Trends for Nov.30th 2021
Green: Increase from previous day
Red: Decrease from previous day
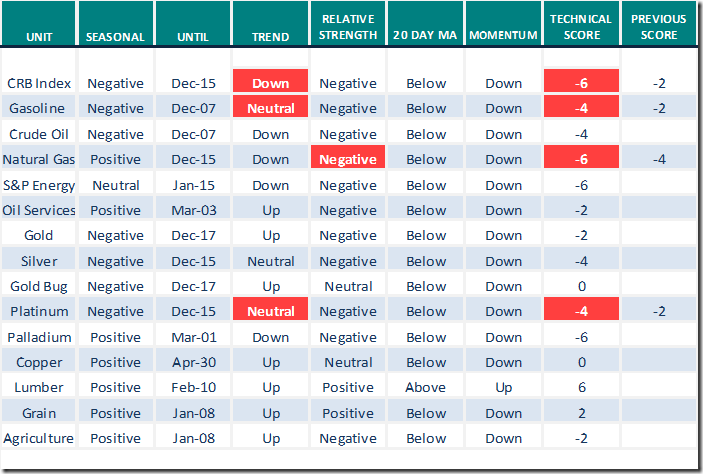
Commodities
Daily Seasonal/Technical Commodities Trends for Nov.30th 2021
Green: Increase from previous day
Red: Decrease from previous day
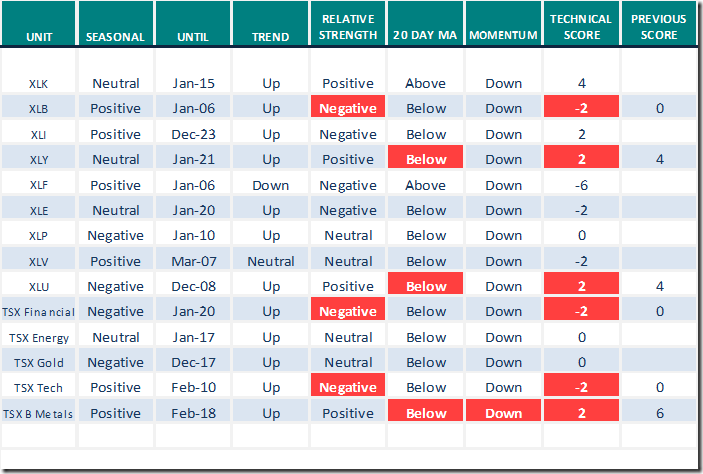
Sectors
Daily Seasonal/Technical Sector Trends for Nov.30th 2021
Green: Increase from previous day
Red: Decrease from previous day
All seasonality ratings are based on performance relative to the S&P 500 Index (except TSX).
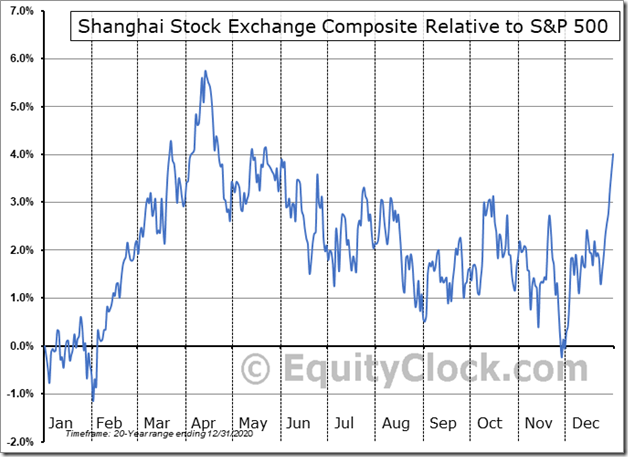
Seasonality Chart of the Day from www.EquityClock.com
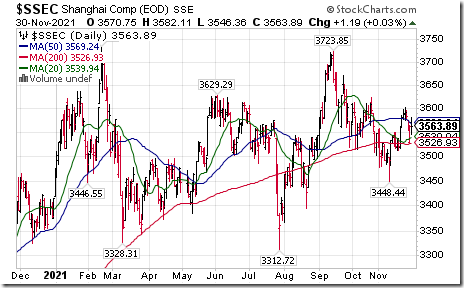
Seasonal influences on a real and relative basis for the Shanghai Composite Index are favourable from the end of November to mid-April.
The Index currently is in an intermediate uptrend. It trades above its 20, 50 and 200 day moving averages. Strength relative to the S&P 500 has just turned positive. The Index normally moves higher prior to Chinese New Year (Feb.1). Anticipation of Winter Olympics in Beijing will help.
S&P 500 Momentum Barometers
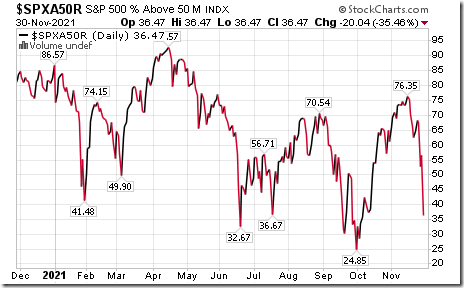
The intermediate term Barometer plunged 20.04 to 36.47 yesterday. It changed from Neutral to Oversold on a move below 40.00, but has shown no sign of bottoming.
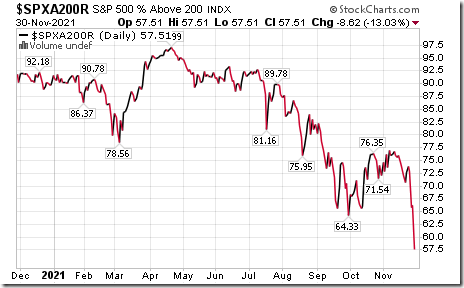
The long term Barometer plunged 8.62 to 57.51 yesterday. It changed from Overbought to Neutral on a move below 60.00, but has shown no sign of bottoming.
TSX Momentum Barometers
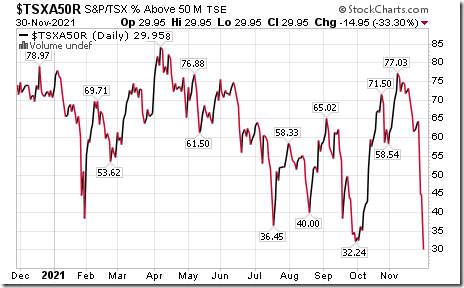
The intermediate term Barometer plunged 14.95 to 29.95 yesterday, lowest level since November last year. Barometer changed from Neutral to Oversold on a move below 40.00, but has yet to show signs of bottoming.
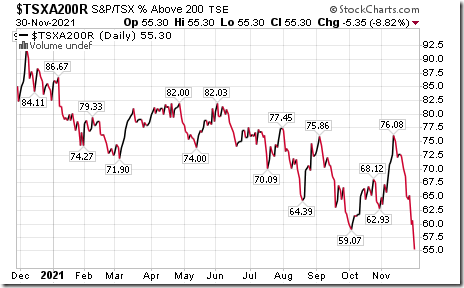
The long term Barometer dropped 5.35 to 55.30 yesterday. It changed from Overbought to Neutral on a move below 60.00, but has yet to show signs of bottoming.
Disclaimer: Seasonality and technical ratings offered in this report and at
www.equityclock.com are for information only. They should not be considered as advice to purchase or to sell mentioned securities. Data offered in this report is believed to be accurate, but is not guaranteed
This post was originally publised at Vialoux's Tech Talk.


