
by Rick Rieder, Managing Director, Chief Investment Officer, Global Fixed Income, Blackrock
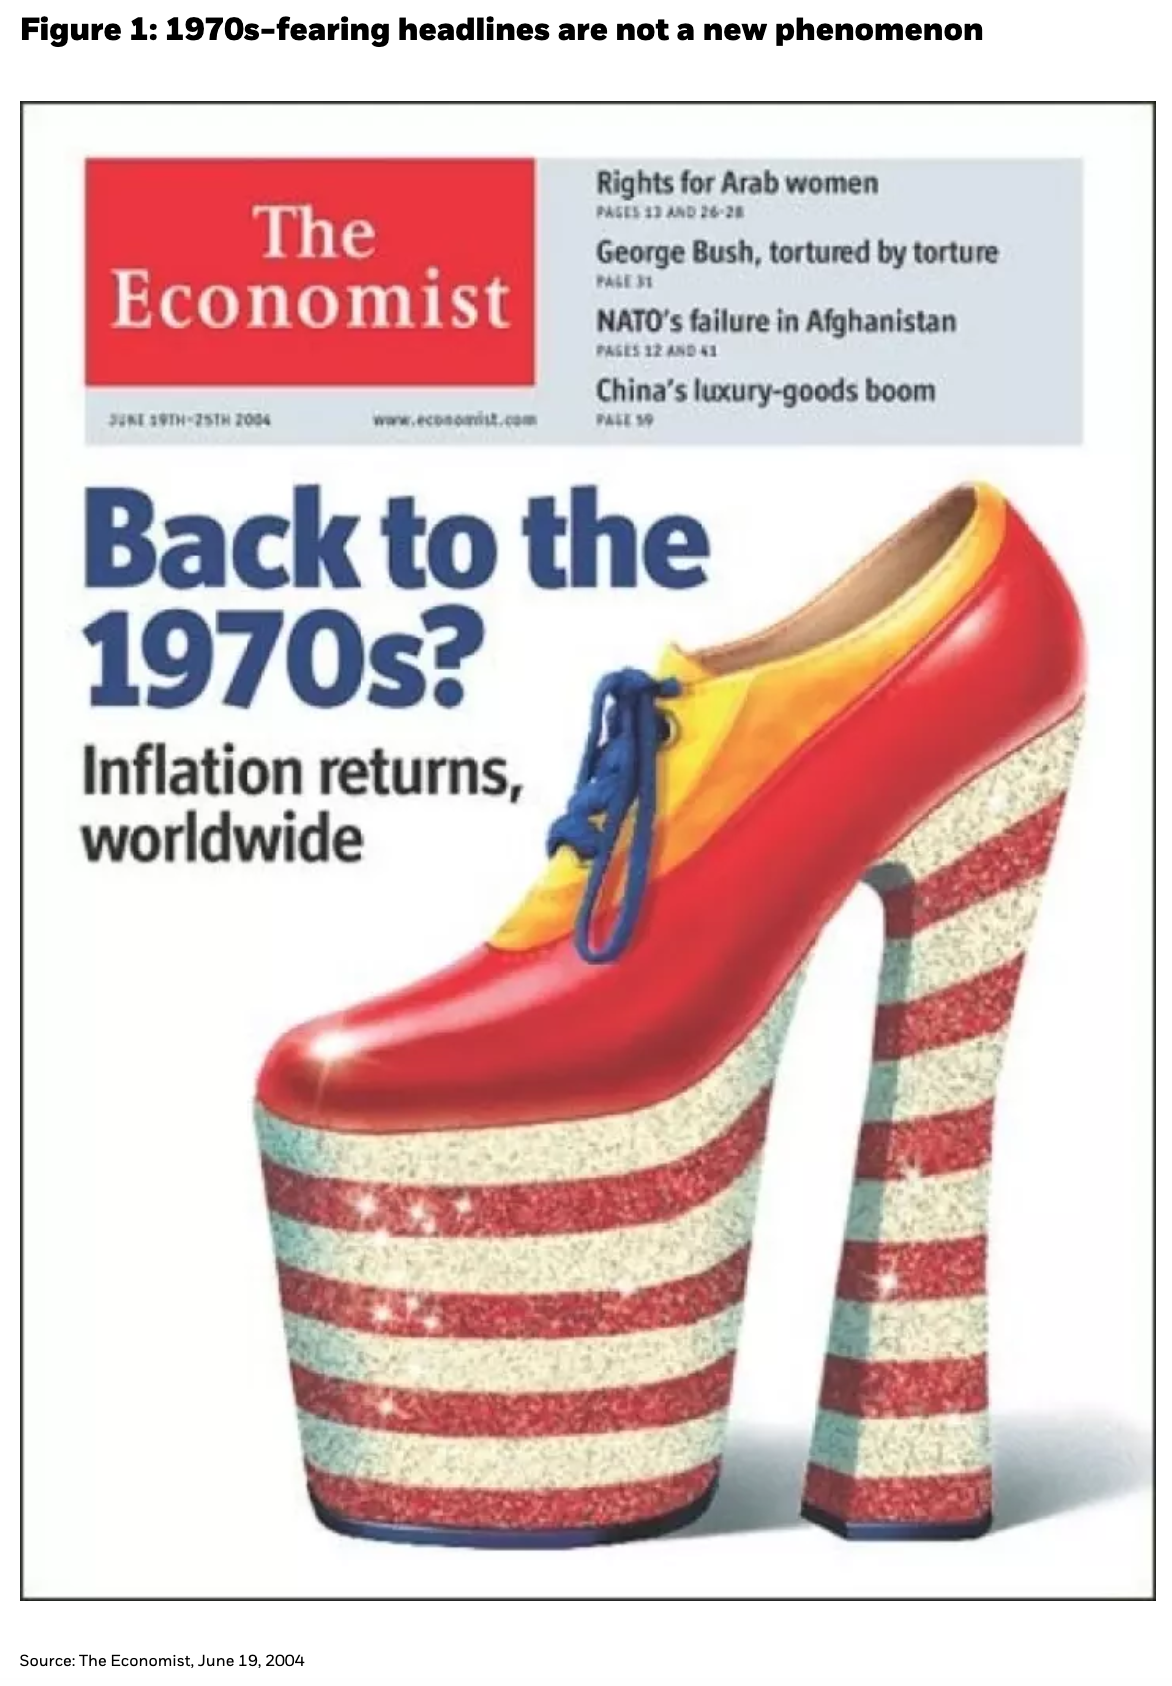
In the 1985 cult classic “Back to the Future,” actor Michael J. Fox plays a teenager who travels back in time and gets stuck in the past, trying desperately to return “back to the future.” For investors, the Bureau of Labor Statistics’ latest inflation report may raise feelings of déjà vu and concerns about economies, and subsequently markets, being stuck in their own time warp; a return to the inflationary 1970s. However, this isn’t the first time the world has been worried about a return to the 1970s. In fact, ever since the 1970s, almost any period of above-consensus inflation has been met with headlines that have alluded to the 1970s in some form or other, a trend perfectly encapsulated in The Economist cover from mid-2004 (see Figure 1). Suffice to say, the 1970s aren’t usually the first thing that comes to mind when we look back at the 2000s from today’s vantage point.
Still, maybe 2021 is less different than before, as there are some apparent similarities? We’ve witnessed the end of a long war (Vietnam in the 1970s versus Afghanistan in 2021), we’re in a supply chain crisis (the 1970s was a decade known for shortages) and in the midst of a cold war (substitute the Soviet Union for China). Yet, despite these similarities, there are three main reasons why economies aren’t going back to the 1970s.
Three Key Reasons This Isn’t the 1970s for the Economy
First, organic demand growth in terms of new disposable income is not going back to the 1970s. In the United States, the share of new workers, as measured by the 15-34 year age group, peaked in 1980 alongside inflation. That age group is an important driver of growth and inflation because, on average, they make several critical first-time purchases, buying their first car, having their first child and buying their first house, often on credit. Separately, another source of new disposable income, female participation in the labor force, had its greatest gain in the 1970s. So, while demand is certainly exceptional today (as we described in our previous commentary, Halloween and Christmas for Markets, these 1970s-era drivers were one-time phenomena.
Follow Rick Rieder on Twitter
Second, supply and consumption patterns have changed dramatically since the 1970s and are unlikely to reverse course. The development of the global supply chain had two pivotal moments: first, when Deng Xiaopeng opened up China’s economy in 1979, and second, when China joined the WTO in 2001. Each time, world trade inflected higher, dwarfing GDP growth (see Figure 2). These events allowed huge quantities of new supply to enter the global economy, from goods to labor, both flattening the supply curve and pushing it to the right. This deflationary impact of globalization on goods, decade after decade, has allowed consumption to be increasingly oriented around services – until very recently, as the pandemic has temporarily disrupted the consumption of a variety of services. But today’s supply chain bottlenecks, the result of an unusual two-year surge in goods demand, do not foreshadow a systemic unwind of the structure of the global economy, in our view, or of modern consumption patterns (think Millennials’ love of “experiences”).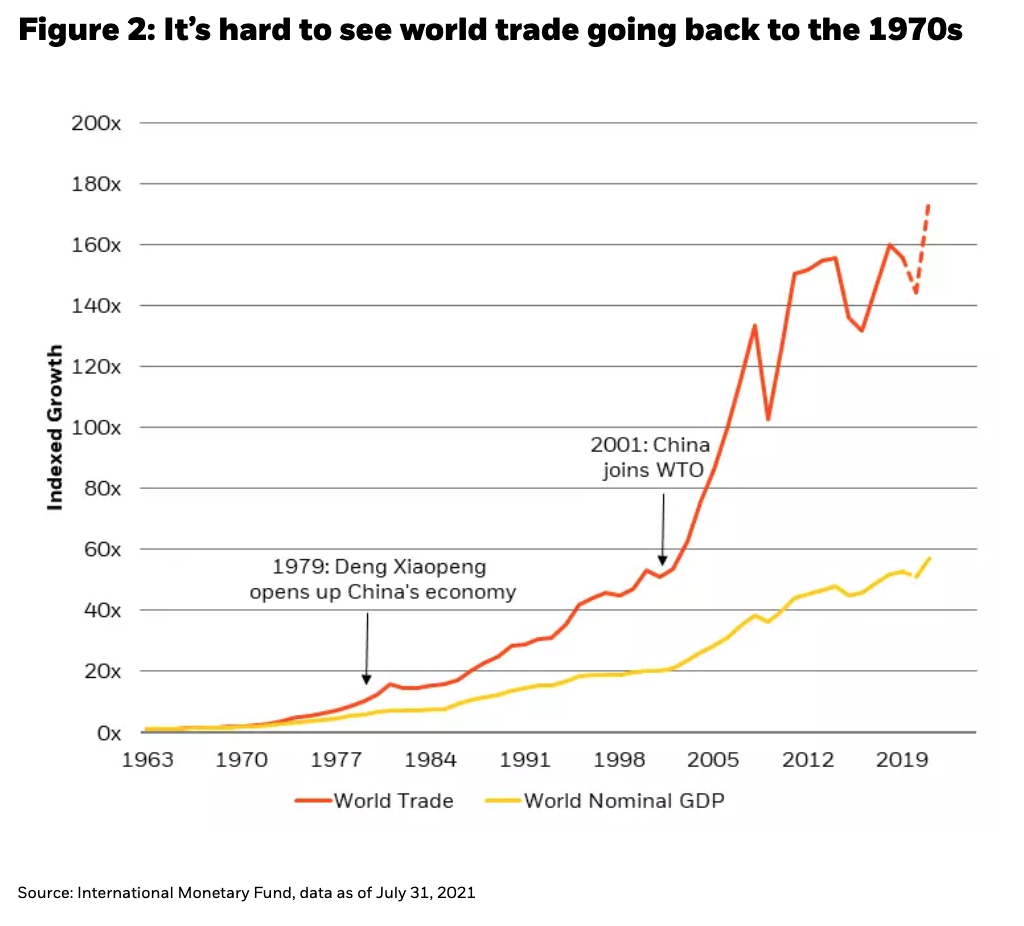
Third, we can’t talk about the 1970s without mentioning how influential oil prices were, and how unlikely it is for those influences to repeat themselves. Over the course of that decade, oil prices went from about $2 to $32, and it’s difficult to see that 16-fold gain in oil prices happening again, given the unique shocks that drove it then, from the end of Bretton Woods to the Iranian Revolution (see Figure 3). In the case of the former, currencies that have been unpegged from a gold standard cannot then be unpegged again. And in the case of the latter, new oil-supply-shock absorbers have been introduced since then: namely OPEC and the rise of the U.S. shale industry. In fact, through a 1970s lens, oil has been stable for decades. Meanwhile, the consumer’s wallet has continued growing alongside, such that consumption is a lot less energy intensive today than it was then. Indeed, gasoline is only about 2% of the U.S. consumer’s wallet today, down from about 6% in 1980. Thus, higher energy prices this winter can lift energy asset prices, in our view, but won’t destroy the consumer’s pocketbook.

Yet Are There Market and Policy Parallels to the ‘70s?
So, economies won’t go back to the 1970s – but it’s a bit more complicated for markets. When real yields are too high or too low, they can flip the traditional stock/bond correlation. In the 1970s, real yields were deeply negative, as they are now. That “1970s style” stock/bond correlation is a worry because modern portfolios are built on risk parity-like characteristics (meaning bond yields are expected to decline when stock prices decline), but current yield levels don’t leave as much room for fixed income to make as much of a positive contribution to portfolios as it has in recent decades. On a shorter lookback, the deeply entrenched long-term correlation between U.S. equity markets (proxied by the S&P 500 here) and U.S. Treasuries has broken down (see Figure 4), injecting volatility into portfolios. In the absence of duration as a reliable hedge, portfolios may need to own volatility through options, or simply hold more cash instead (a measure we previously described in our commentary, The Queen’s Gambit Declined).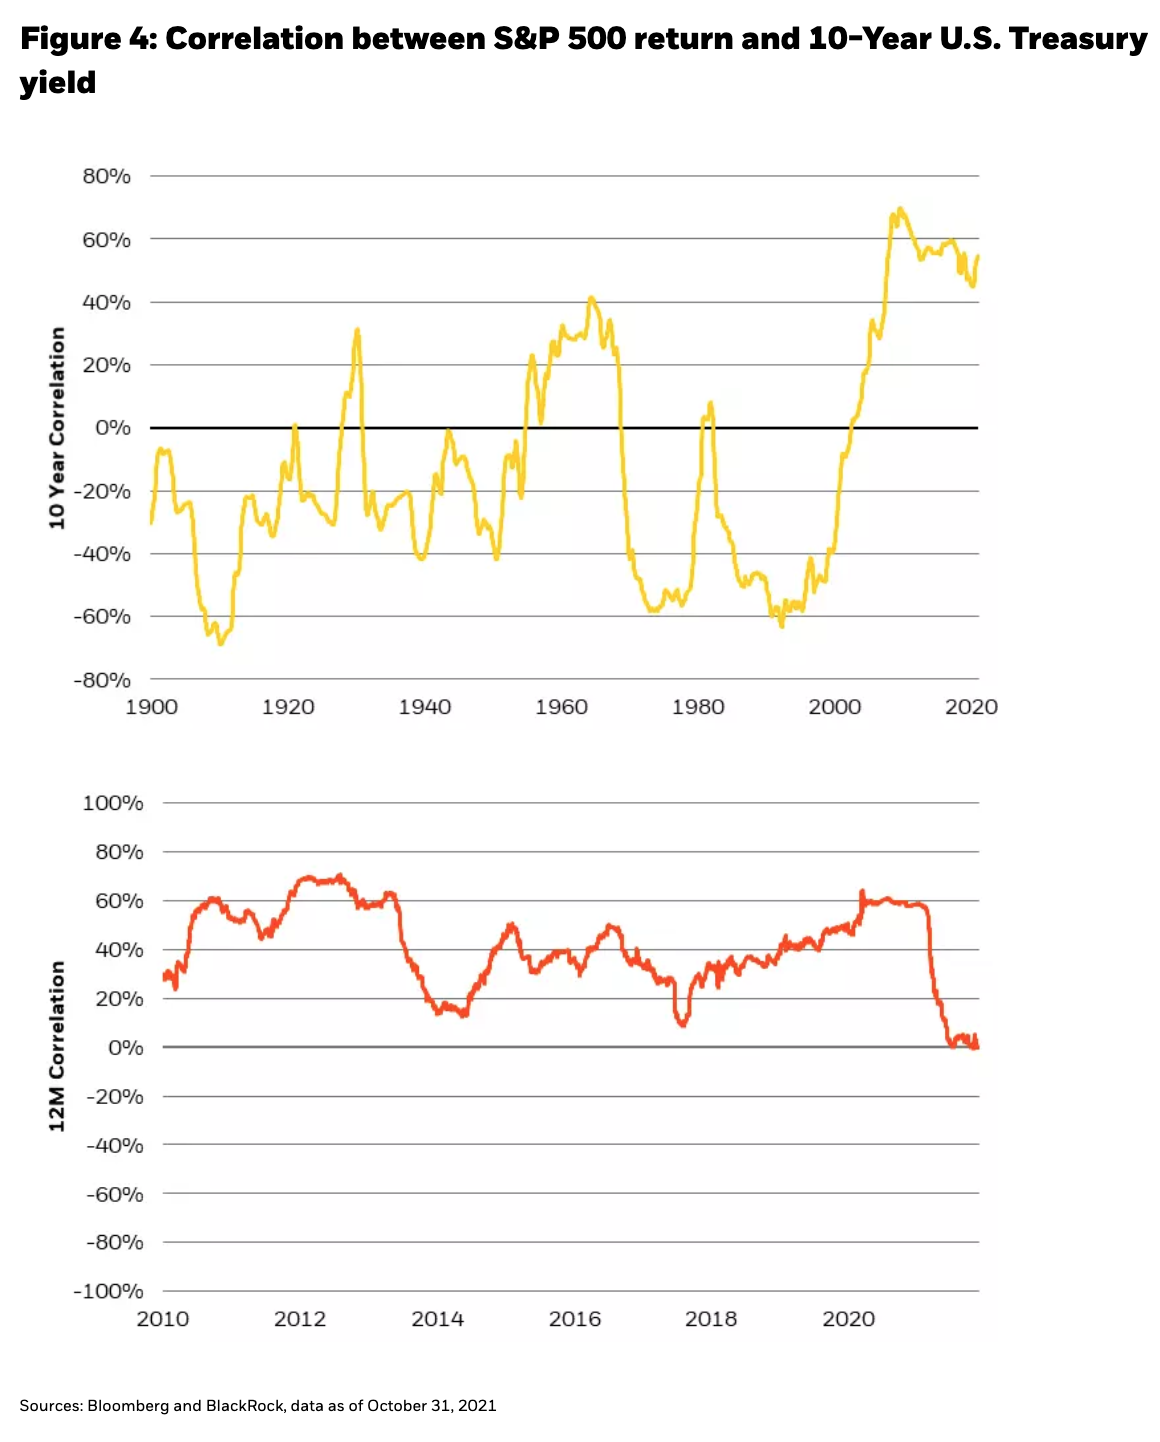 In our view, the single biggest parallel between the 1970s and the 2020s is not inflation, but the ability of extreme monetary policy to influence future market returns. The shock-and-awe policy of the late 1970s came in the form of a policy rate hiking cycle that culminated in a 20% Federal Funds rate to combat inflation. So far in the 2020s, it’s been a doubling of the monetary base – essentially printing $3 trillion – to stimulate consumption (Figure 5).
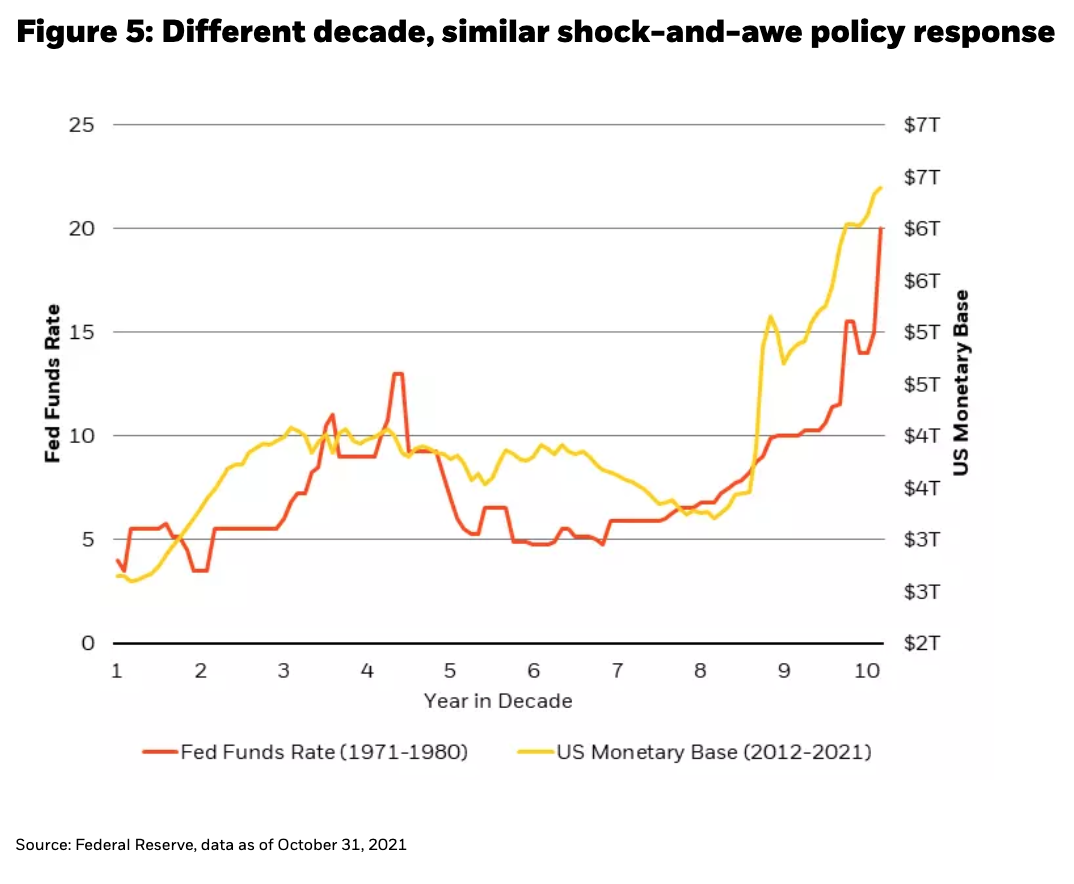
Lessons Learned From History
Fascinatingly, both these policy measures create the same forward influence on the denominator of the terminal value equation: the discount rate less the growth rate, or “r-g.” By 1980, a high Fed Funds rate meant that portfolios should be oriented around a falling discount rate (“r”) for years afterward, while today’s liquidity regime means that portfolios should be oriented around a sticky high growth rate (“g”) – again, potentially lasting for years. A declining “r,” or a rising “g,” are both supportive of asset prices, mathematically speaking, but the former makes assets with high fixed interest rates exceptionally attractive, while the latter supports assets with cash flows that can capture higher growth rates.
So, when it comes to asset allocation, the 1970s do in fact offer a valuable lesson for portfolios in 2021, just not quite a parallel, rather than a yin/yang image: overweight nominal assets in 1980, but overweight real assets today. Indeed, the harder it is for an asset to be printed, the more “real” it is, and if it can generate a steady stream of cash flow, then all the better.
About Rick Rieder
 Rick Rieder, Managing Director
Rick Rieder, Managing Director, is BlackRock’s Chief Investment Officer of Global Fixed Income and is Head of the Global Allocation Investment Team.