
by Talley Léger, Invesco Canada
Consumers are understandably vocal about inflation’s hit to their pocketbooks. But Talley Léger believes investors can potentially benefit in both hot and cold inflation environments.
Key takeaways
- Margins. The topping process can take over a year to complete. In the meantime, margins may remain high, providing an ample albeit fading tailwind for earnings and stock market returns.
- Inflation. If it weren’t for accelerating producer prices, total business sales would be advancing at a significantly slower pace.
- Sectors. Historically, energy stocks outperformed in hotter inflation environments, and consumer discretionary stocks outperformed in cooler inflation environments.
Despite investor concerns about lofty valuations and liquidity-fueled asset price inflation, stocks have behaved largely as I expected in the second year of this new market cycle by growing into their price-to-earnings (P/E) multiples.1
Indeed, the S&P 500 Index’s exceptional 25% year-to-date (YTD) price return has been driven by a 65% surge in trailing four-quarter operating earnings per share (EPS) in the same timeframe.2 Meanwhile, the S&P 500 Index’s P/E ratio has compressed by 25% to 23x from 31x at the end of last year.2
What’s behind the surge in corporate profits?
One method of forecasting bottom-line earnings is to project top-line revenues and apply a suitable profit margin.
Encouragingly, trailing four-quarter sales per share (SPS) have grown by a robust 11% YTD on the back of the ongoing global economic expansion.2
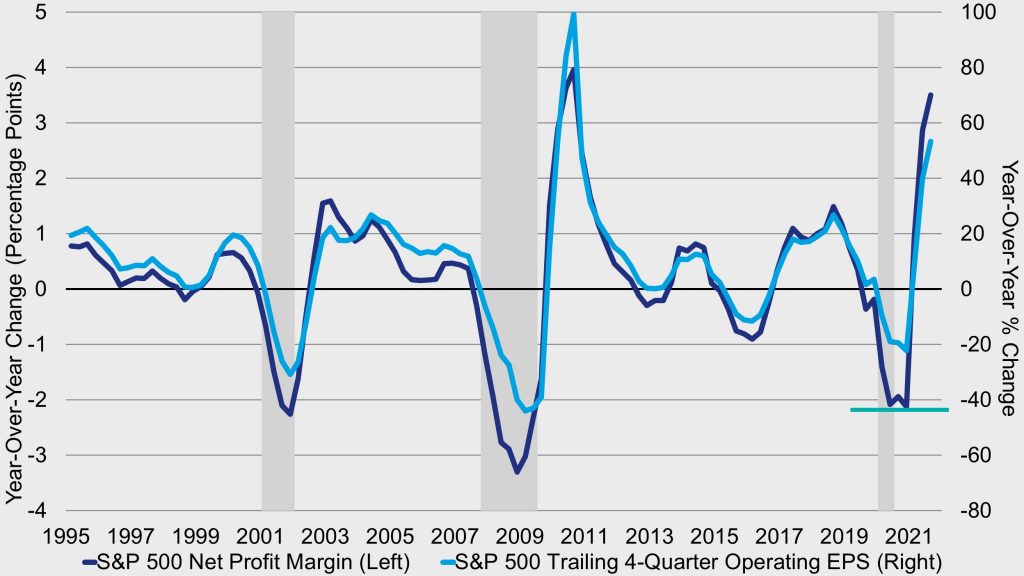
As impressive as that is, however, net profit margins – or the percentage of income remaining after all the bills are paid – have soared 40% YTD to an all-time high of 13% from 9% at year-end 2020 (Figure 1)!
Figure 1: Profit margins have soared to an all-time high
U.S. profit margin changes (dark blue) and earnings growth (light blue) since 1995
Where are profit margins heading from here?
One directional leading indicator of profit margins is the difference between total business sales growth and total nonfarm payroll growth. Simply put, when top-line revenues grow faster than hiring – the single largest expense for any business – margins rise. In fact, that’s exactly what happened this cycle, but to a degree unseen before in the history of the series (Figure 2)!
Figure 2: This directional leading indicator points to a peak in margins – a process that may take over a year to complete
Leading margin indicator (dark blue, pushed forward) and profit margin (light blue) since 1996
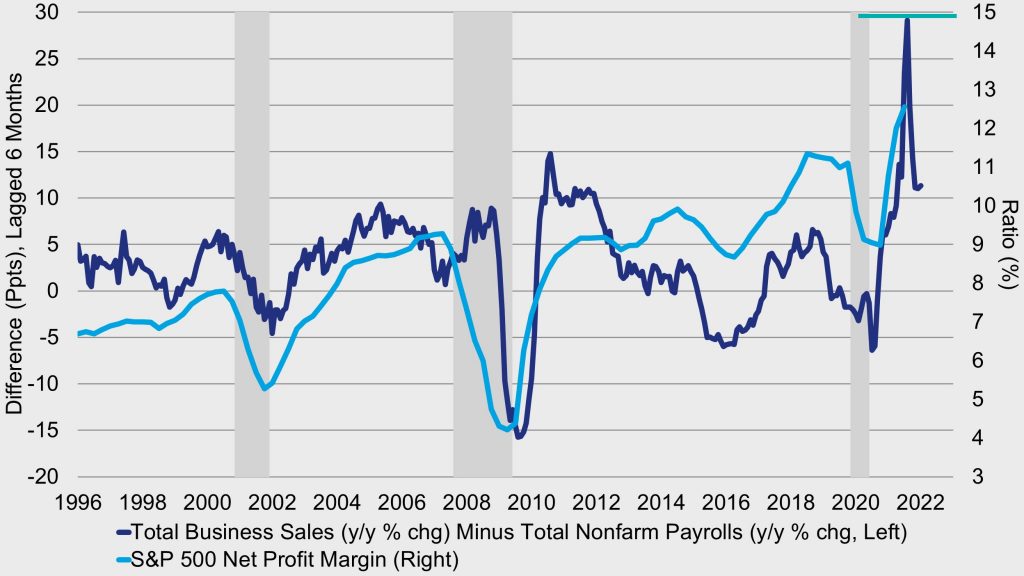
Alas, economic gravity is a powerful force, and the natural laws argue that margins can’t keep going up indefinitely. In recent months, the sharply narrower spread between sales and payroll growth points to an inevitable peak in margins.
Fortunately, history shows that the broad topping process can take over a year to complete. In the meantime, margins may remain at a high level, thereby providing an ample albeit waning tailwind for earnings and stock market returns.
Isn’t inflation bad?
The answer to that question depends on one’s point of view. To a certain extent, what’s bad for consumers – inflation in this case – can actually be good for producers. The opposite is also true.
Business revenues are equal to the volume of goods and services sold multiplied by their per-unit selling prices. That concept is illustrated in Figure 3, which plots a revenue proxy – the product of the producer price index (PPI) for finished goods and total industrial production – alongside total business sales over the past three decades.
Figure 3: Silver lining – If it weren’t for accelerating producer prices, total business sales would be advancing at a significantly slower pace
Revenue proxy (dark blue) and total business sales (light blue) since 1993
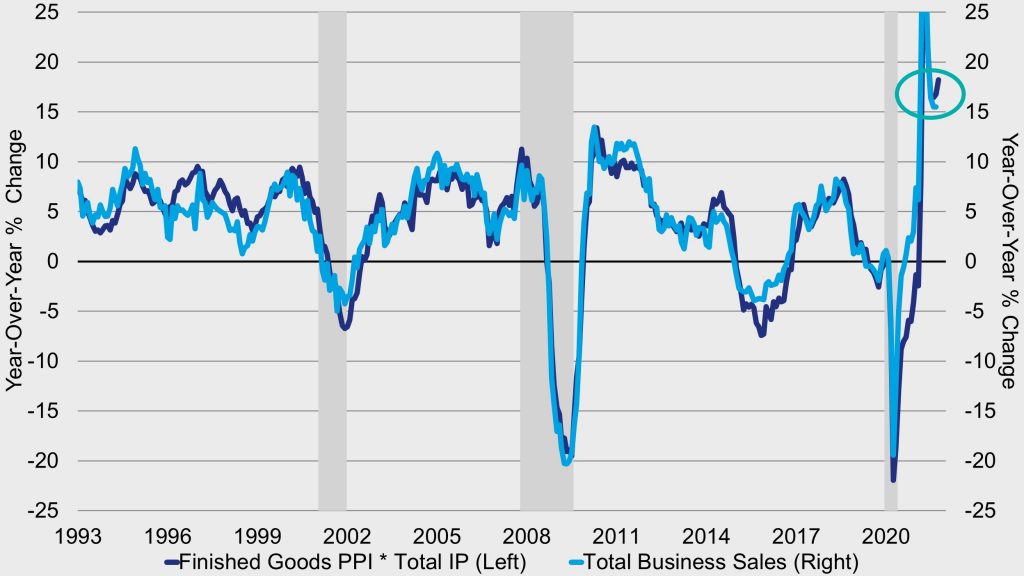
Ideally, firms desire to maximize revenues by selling more goods at higher prices. But that impulse is clearly unsustainable, especially in the current environment of labour shortages and production bottlenecks where volume growth has decelerated rapidly (5% y/y).3 Firms can’t sell what they aren’t making.
If it weren’t for accelerating producer prices (12% y/y), however, total business sales would be advancing at a significantly slower pace (16% y/y).3
How can investors potentially benefit from changing inflation trends?
Consumers are understandably vocal about inflation’s negative impact on their purchasing power and standards of living. From that perspective, it’s no mystery why the S&P 500 Consumer Discretionary sector has been underperforming the overall stock market YTD (Figure 5). Intuitively, rising costs for things such as energy (30% y/y) and used cars and trucks (26% y/y) have taken a real bite out of consumer pocketbooks, leaving less money for discretionary expenditures.4
The good news is that it’s possible for investors to benefit by adjusting their portfolio positioning in different inflation environments. Figure 4 highlights the relative sensitivity of S&P 500 sector returns to consumer price inflation trends since the early 2000s.
It should come as no surprise that what’s bad for the consumer cyclical space, namely high and rising energy costs, is good for energy producers – the best performing sector YTD (Figure 5). Accelerating inflation, especially when led by energy prices, has generally been a tailwind for S&P 500 Energy sector performance, and this time is no exception.
Figure 4: Energy stocks have been inflation beneficiaries; consumer discretionary stocks have been inflation sensitive
Relationship between consumer price inflation and relative sector returns since 2001
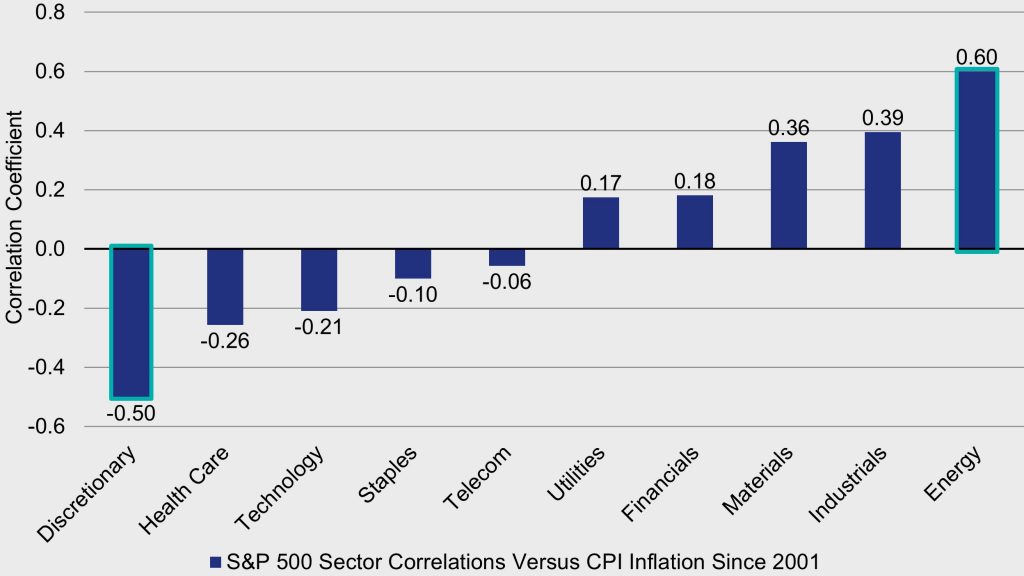
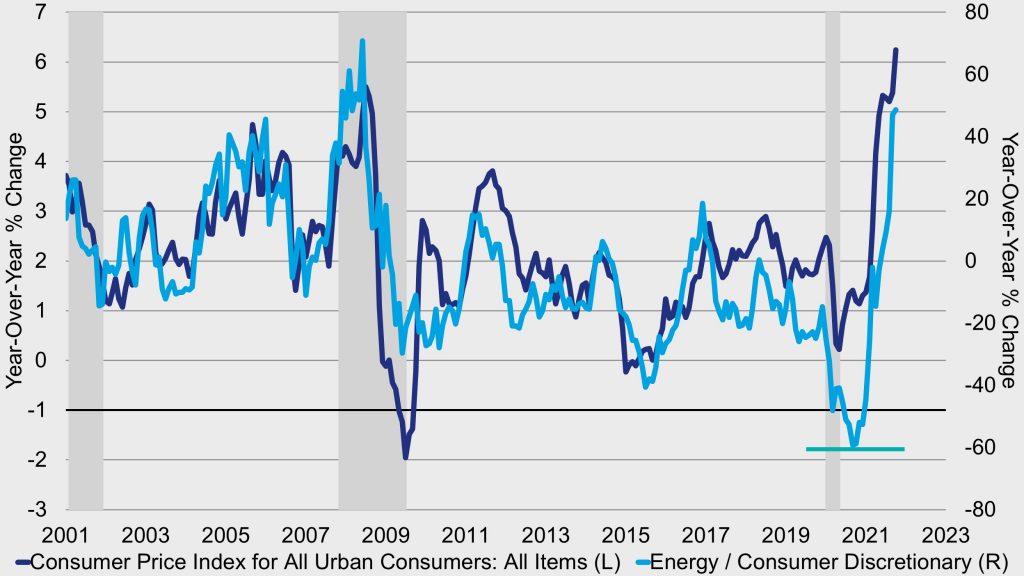
At the extremes, investors can structure a useful sector pair trade for partially insulating their holdings to both hotter and cooler investing climates. Specifically, energy stocks have outperformed in a hotter inflation environment, and consumer discretionary stocks have outperformed in a cooler inflation environment (Figure 5).
Figure 5: Pair trade – energy stocks have outperformed in a hotter inflation environment, consumer discretionary stocks have outperformed in a cooler inflation environment
Consumer price inflation (dark blue) and performance of energy relative to consumer discretionary stocks (light blue) since 2001
The trick is successfully navigating the turn in the inflation cycle, which is easier said than done. Indeed, near-term prices could prove “sticky” and energy stocks could keep working for some months yet.
Nonetheless, oil price inflation – a key driver of headline inflation – has decelerated sharply as oil prices have risen at a significantly slower pace. In my view, the strong influence and leading characteristic of oil augurs an easing of non-food and energy inflation, albeit with a lagged effect. 5
If that long-term view is correct and inflation ultimately resolves to the downside, the implication is that the bulk of the acceleration in energy sector outperformance is likely behind us. Energy stocks can still perform well heading into next year, but probably not as well as they did this year.
Eventually, I believe the lagged supply and production response should help prices settle back down to a lower equilibrium, giving consumer discretionary stocks a chance to shine.
1 Source: “Is the best yet to come for U.S. stocks?” Invesco, May 14, 2021.
2 Source: Standard & Poor’s, 11/4/21
3 Sources: U.S. Bureau of Labor Statistics, FRED, Invesco, 10/29/21
4 Source: U.S. Bureau of Labor Statistics, 11/5/21.
5 Source: “Three market ‘scares’ that may become less frightening after Halloween” Invesco, October 20, 2021.
This post was first published at the official blog of Invesco Canada.