by Don Vialoux, EquityClock.com
Technical Notes released yesterday at
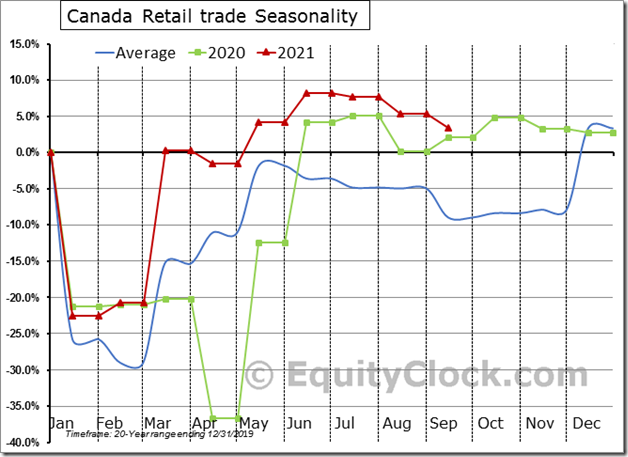
Retail sales in Canada slipped by 1.9% (NSA) in September, which is much stronger than the 4.1% decline that is average for this time of year. Strength in gasoline, clothing, shoes, and jewelry store sales in recent months highlight how consumers are emerging from COVID isolation. $MACRO $STUDY #CDNecon #CAD
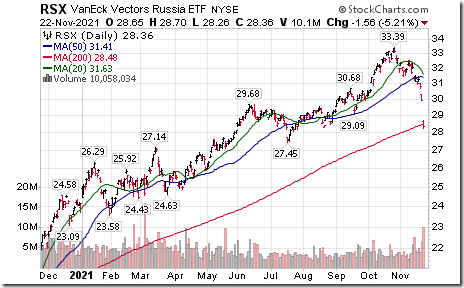
Russia ETF $RSX moved below $29.09 extending an intermediate downtrend. Responding to lower crude oil and natural gas prices.
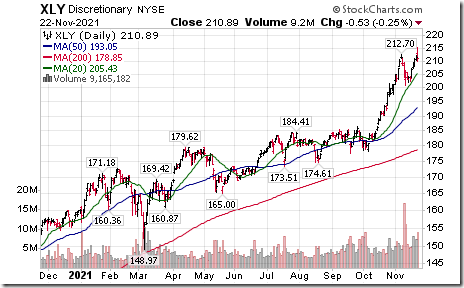
Consumer Discretionary SPDRs $XLY moved above $176.66 to an all-time high extending an intermediate uptrend.
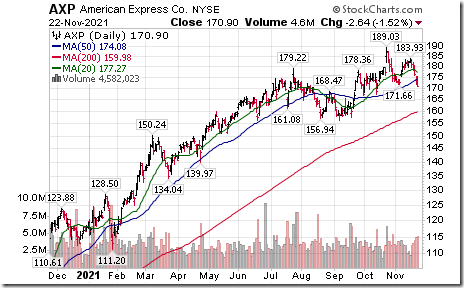
American Express $AXP a Dow Jones Industrial Average stock moved below $171.66 completing a double top pattern.
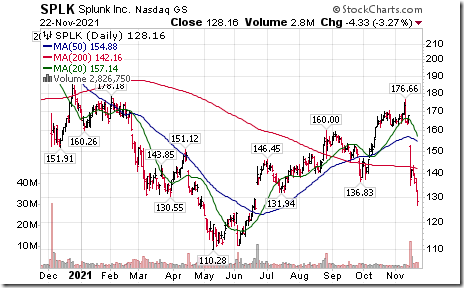
Splunk $SPLK a NASDAQ 100 stock moved below $131.94 extending an intermediate downtrend.
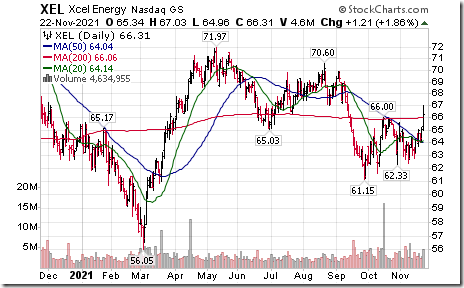
Xcel Energy $XEL a NASDAQ 100 stock moved above $66.00 resuming an intermediate uptrend.
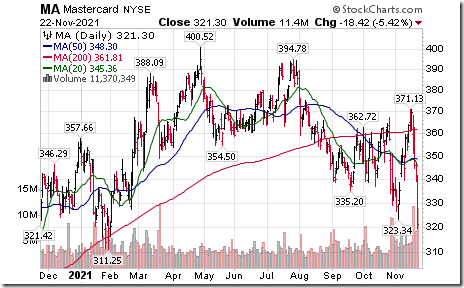
MasterCard $MA an S&P 100 stock moved below $323.34 extending an intermediate downtrend.
Trader’s Corner
Equity Indices and Related ETFs
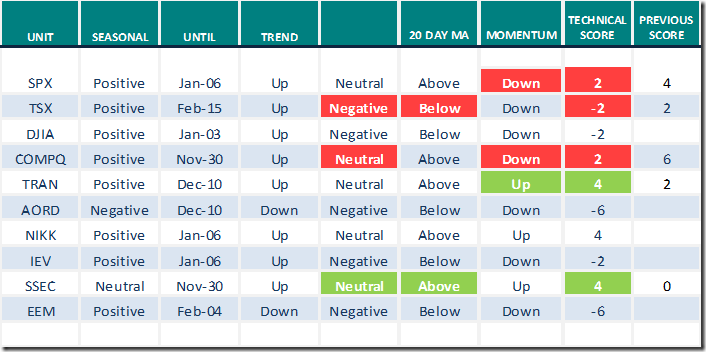
Daily Seasonal/Technical Equity Trends for Nov.22nd 2021
Green: Increase from previous day
Red: Decrease from previous day
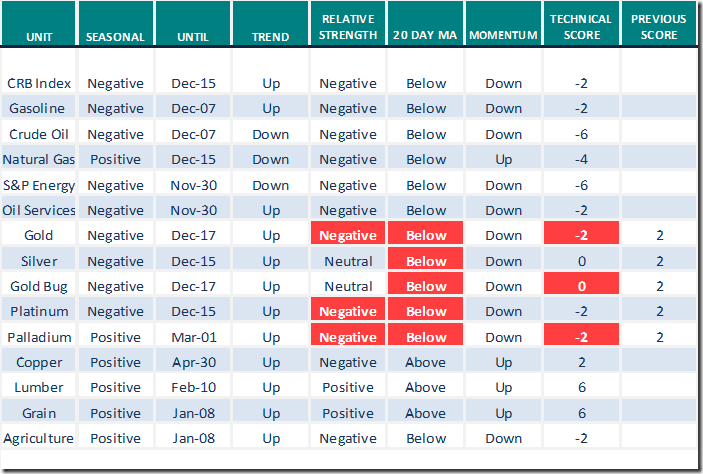
Commodities
Daily Seasonal/Technical Commodities Trends for Nov.22nd 2021
Green: Increase from previous day
Red: Decrease from previous day
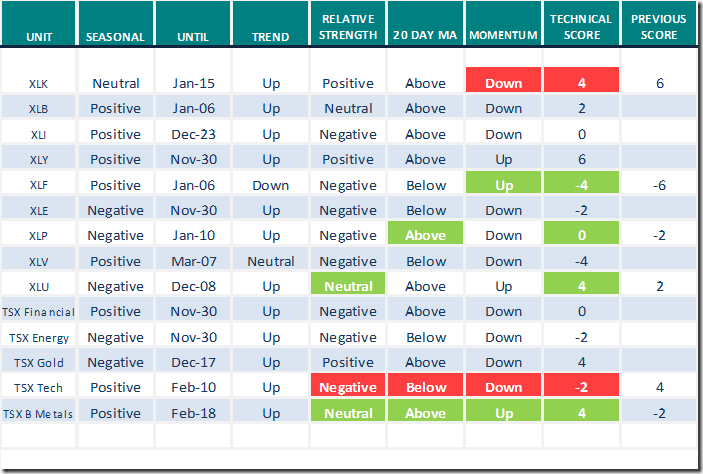
Sectors
Daily Seasonal/Technical Sector Trends for Nov.22nd 2021
Green: Increase from previous day
Red: Decrease from previous day
All seasonality ratings are based on performance relative to the S&P 500 Index (except TSX).
Free registration to the MoneyShow Canada Virtual Expo
Watch Live: MoneyShow Canada Virtual Expo | November 30 – December 2, 2021
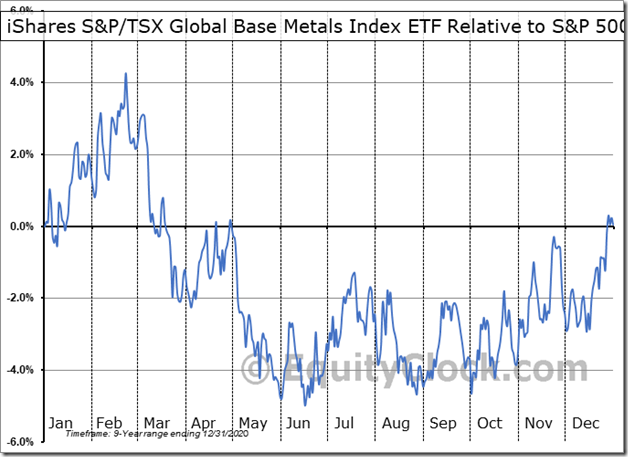
Seasonality Chart of the Day from www.EquityClock.com
Seasonal influences on a real and relative basis for the base metals sector are favourable to mid-February.
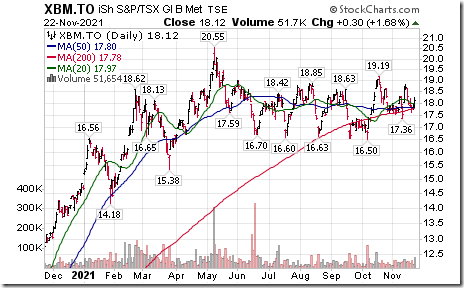
Technical parameters finally are showing signs of improvement. Yesterday, strength relative to the S&P 500 Index turned from negative to neutral, units moved above their 20 and 50 day moving averages and short term momentum indicators (Stochastics, RSI, MACD) turned higher.
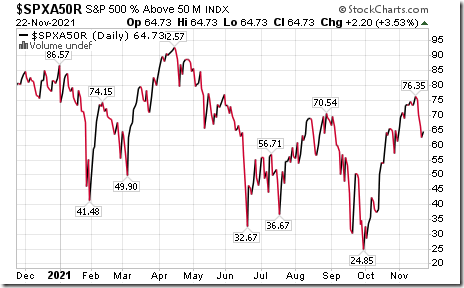
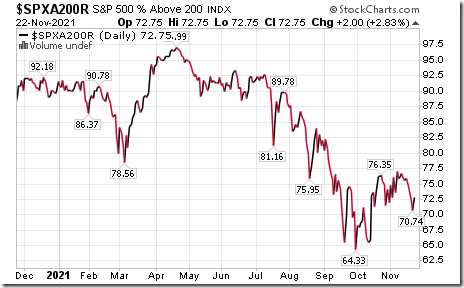
S&P 500 Momentum Barometers
The intermediate term Barometer added 2.20 to 64.73 yesterday. It remains Overbought.
The long term Barometer added 2.00 to 72.75 yesterday. It remains Overbought.
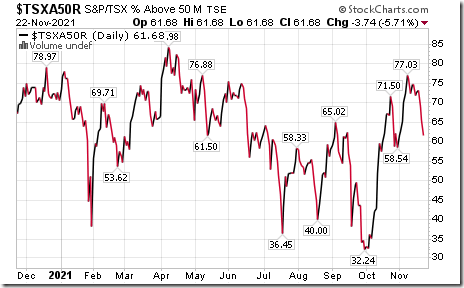
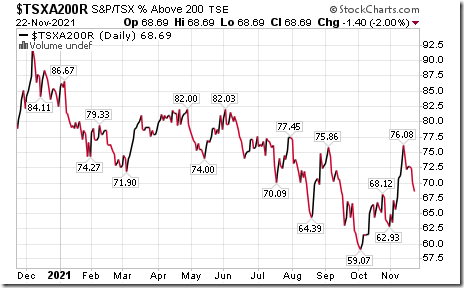
TSX Momentum Barometers
The intermediate term Barometer dropped 3.74 to 61.68 yesterday. It remains Overbought and trending down.
The long term Barometers slipped 1.40 to 68.69 yesterday. It remains Overbought and trending down.
Disclaimer: Seasonality and technical ratings offered in this report and at
www.equityclock.com are for information only. They should not be considered as advice to purchase or to sell mentioned securities. Data offered in this report is believed to be accurate, but is not guaranteed
This post was originally publised at Vialoux's Tech Talk.


