by Don Vialoux, EquityClock.com
Appearance on Michael Campbell’s Money Talks
Don Vialoux is a guest on Michael Campbell’s weekly radio show starting at 8:30 AM Mountain Standard Time (11:30 EST) on Saturday November 20th. Access is available at Michael Campbell’s MoneyTalks – Market Analysis & Commentary (mikesmoneytalks.ca)
Technical Notes released yesterday at
Inflationary pressures are not just isolated to the US. Canada CPI was higher by 0.7% in October, much stronger than the unchanged result that is average for this time of year. $MACRO $STUDY #CDNecon #CAD #CPI
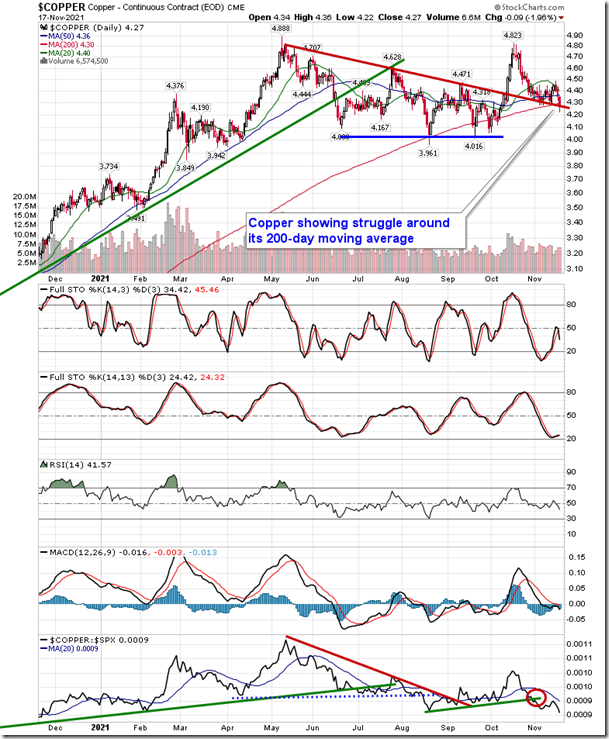
The gyrations in the commodity market on Wednesday pose risk to one of our seasonal trades, but creates an opportunity in another. equityclock.com/2021/11/17/… $HG_F $CL_F $COPX $USO $XLE $XME
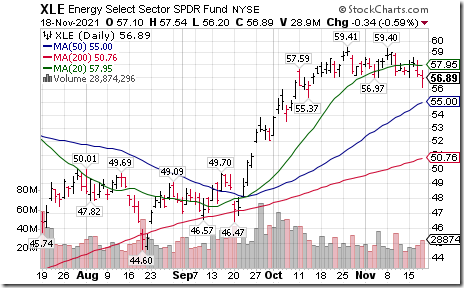
Energy SPDRs $XLE moved below $56.97 completing a double top pattern.
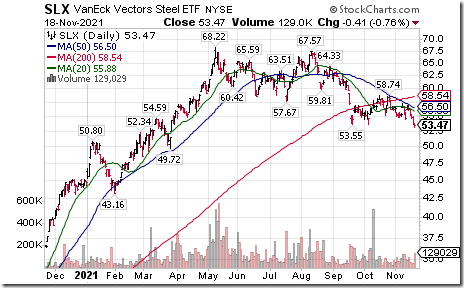
Steel ETF $SLX moved below $53.55 extending an intermediate downtrend.
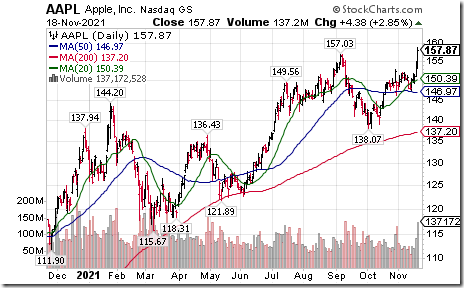
Apple $AAPL a Dow Jones Industrial Average stock moved above $157.03 to an all-time high extending an intermediate uptrend.
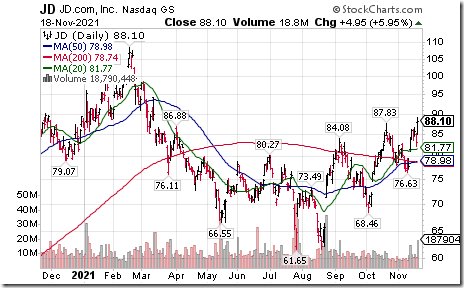
JD $JD a NASDAQ 100 stock moved above $87.83 extending an intermediate uptrend. Seasonal influences are favourable until at least mid-April. If a subscriber to EquityClock see:
https://charts.equityclock.com/jd-com-inc-nasdjd-seasonal-chart
Cisco $CSCO an S&P 100 stock moved below $52.98 completing a double top pattern. Responding to lower guidance.
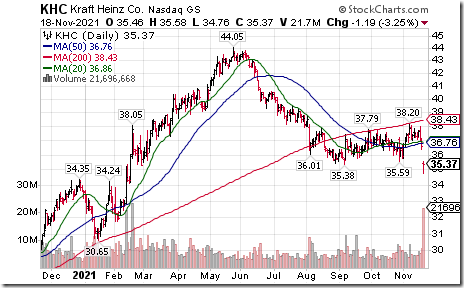
KraftHeinz $KHC an S&P 100 stock moved below $35.38 extending an intermediate downtrend.
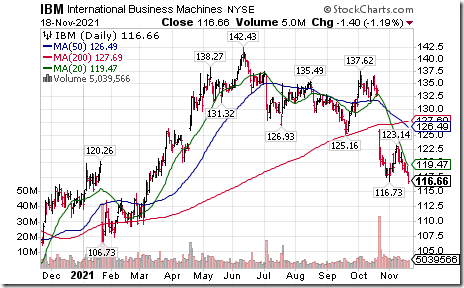
IBM $IBM a Dow Jones Industrial Average stock moved below $116.73 extending an intermediate downtrend.
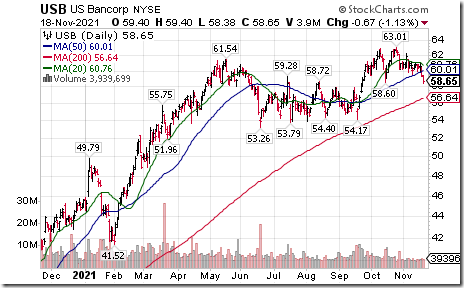
U.S. Bancorp $USB an S&P 100 stock moved below $58.50 completing a double top pattern.
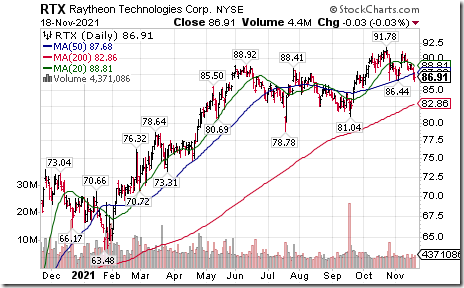
Raytheon Technologies $RTX an S&P 100 stock moved below $86.44 completing a double top pattern.
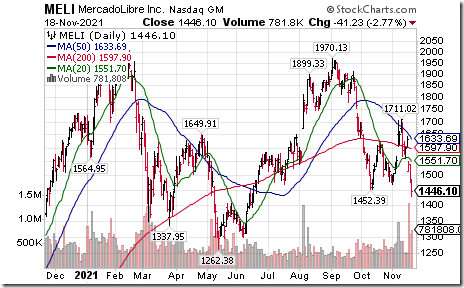
MercadoLibre $MELI a NASDAQ 100 stock moved below $1,452.39 extending an intermediate downtrend.
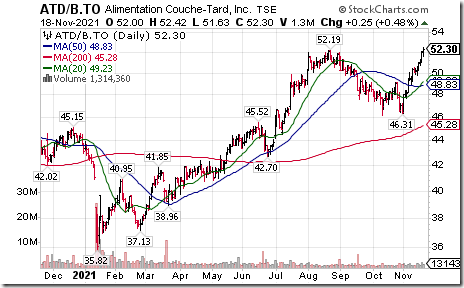
Couche Tard $ATD.B.CA a TSX 60 stock moved above $52.19 to an all-time high extending an intermediate uptrend. Seasonal influences on a real and relative basis are favourable to early March. If a subscriber of EquityClock. See https://charts.equityclock.com/alimentation-couche-tard-inc-tseatd-b-seasonal-chart
Trader’s Corner
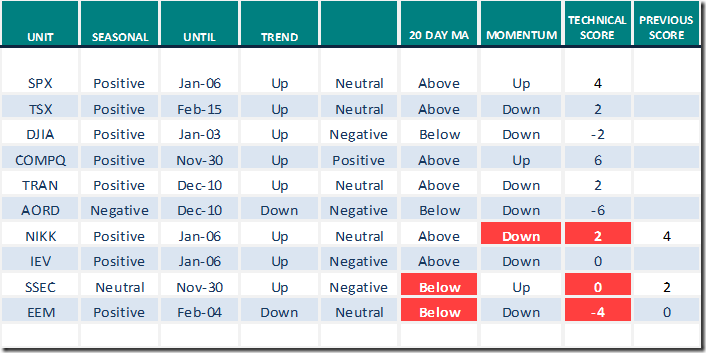
Equity Indices and Related ETFs
Daily Seasonal/Technical Equity Trends for Nov.18th 2021
Green: Increase from previous day
Red: Decrease from previous day
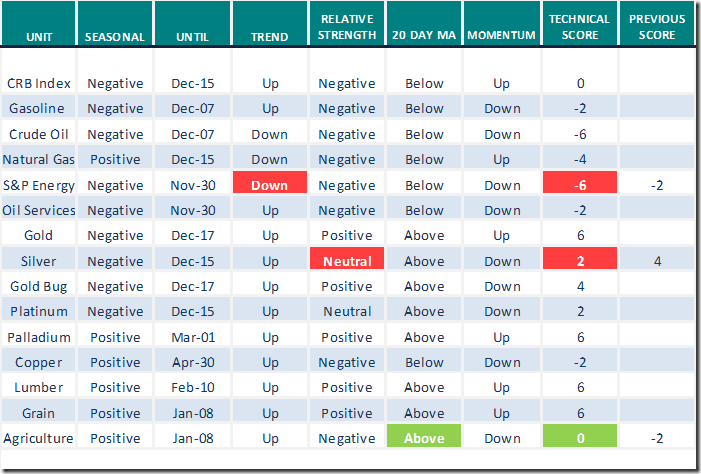
Commodities
Daily Seasonal/Technical Commodities Trends for Nov.18th 2021
Green: Increase from previous day
Red: Decrease from previous day
Sectors
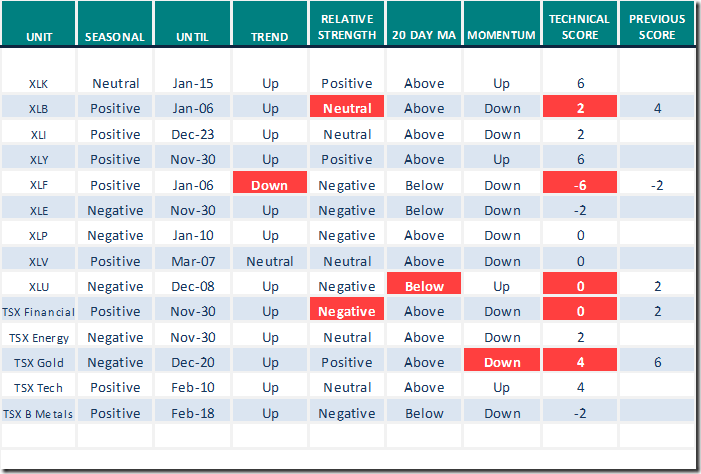
Daily Seasonal/Technical Sector Trends for Nov.18th 2021
Green: Increase from previous day
Red: Decrease from previous day
All seasonality ratings are based on performance relative to the S&P 500 Index (except TSX).
A message from Canadian Association for Technical Analysis
Hello friends of the Canadian Association for Technical Analysis. We have had three events since October. Two were free for all, and the most recent was a members only event. The realities are members help us provide quality content.
The presentations began with Mr. Keith Richards. The result was he placed an excellent perspective on sectors that he saw as moving to interesting levels. Keith also demonstrated how “To beat the Bear”. His discussion on Amazon (AMZN) certainly helped yours truly make money in a short period of time.
The following presentation had Mr. Ron Meisels that spoke about the VIX chart and how to use it catch prices near market lows. Additionally, he was convincing in his view that buying below the 200 day moving average is high risk. There are stocks with less risk, concentrate on better charts.
Our most recent event was Mr. Greg Schnell. Greg showed us profoundly logical techniques for selling issues to book a profit and reduce risk. I learned if the stock signaled another buy signal, you get back in! This was a members only event. Our feedback from attendees is clearly favourable and appreciative of Mr. Schnell.
It’s clear three presentations each presented excellent observations that add to your trading skills. Together, they are generating remarkable value to potential for improving results in members portfolios. Now, extrapolate the knowledge and add soon to come skills. You will be in a position of growth that makes you confident and a greater chance to prosper.
This is why we are reminding you that you won’t want to miss our next presenter:
Mr. David Cox on November 25, 2021 at 8 pm eastern time.
David ( coxdaggett.com ) will be providing profound observations that will continue to add to your knowledge and skill base. You need to be a member of the CATA to take advantage of these extraordinary speakers Join Now. They are definitely some of the best in the business.
The CATA has extra bargains which expire November 30, 2021. It is our introductory offer that provides for 12 months plus 3 free for 15 months of membership at the 12 month price. There’s also an additional reference option to identify a friend that sent you here and provide them with a free month of membership. Join Now
By the way, you can now freely follow the CATA on Twitter @CdnATechA.
Be sure to join us on November 25 at 8 pm eastern time with David Cox @DavidCoxWG.
Join Now
P.S. Don Vialoux is scheduled to give a presentation on December 14th
Seasonality Chart of the Day from www.EquityClock.com
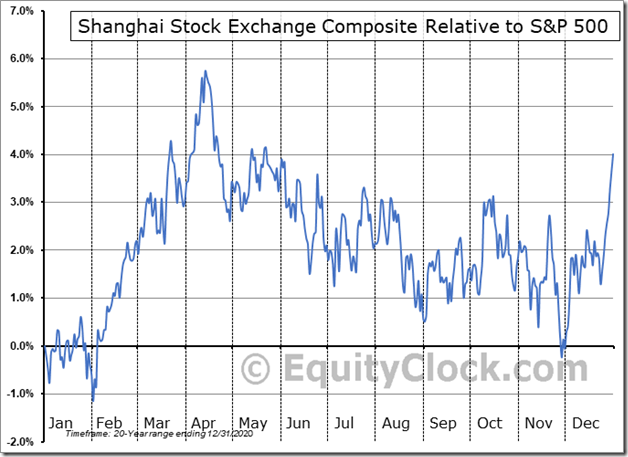
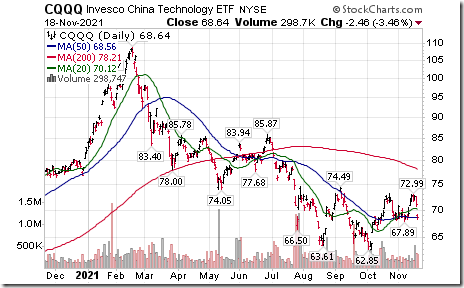
China equity indices and related ETFs are forming interesting base building patterns prior to start of their period of seasonal strength at the end of November. Put on the watch list!
Strength in individuals Chinese stocks such as JD.com yesterday suggests that chances of a seasonal trade in the sector are above average between now and mid-April. Be patient for now!
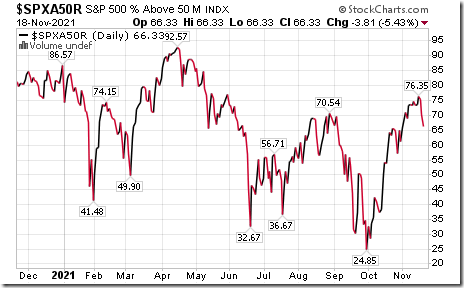
S&P 500 Momentum Barometers
The intermediate term Barometer dropped 3.81 to 66.33 yesterday. It remains Overbought and has started to trend lower.
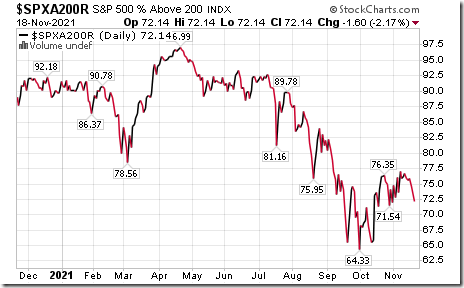
The long term Barometer dropped another 1.60 to 72.14 yesterday. It remains Overbought and has started to trend lower.
TSX Momentum Barometers
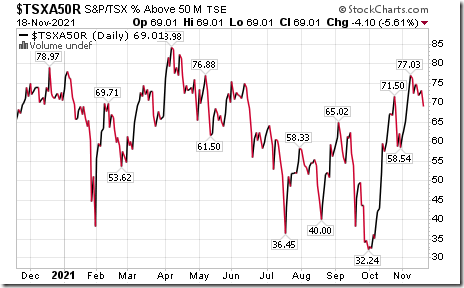
The intermediate term Barometer dropped another 4.10 to 69.01 yesterday. It remains Overbought and has started to trend down.
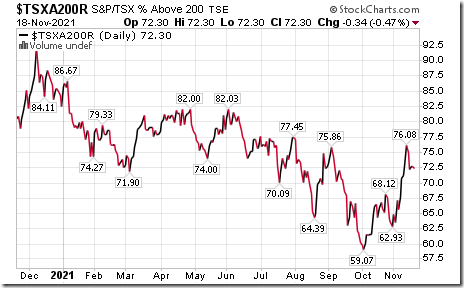
The long term Barometer slipped 0.34 to 72.30 yesterday. It remains Overbought and has started to trend down.
Disclaimer: Seasonality and technical ratings offered in this report and at
www.equityclock.com are for information only. They should not be considered as advice to purchase or to sell mentioned securities. Data offered in this report is believed to be accurate, but is not guaranteed
This post was originally publised at Vialoux's Tech Talk.


![clip_image007[1] clip_image007[1]](https://advisoranalyst.com/wp-content/uploads/2021/11/clip_image0071_thumb.png)
