by Don Vialoux, EquityClock.com
Responses to FOMC news at 2:00 PM EDT yesterday
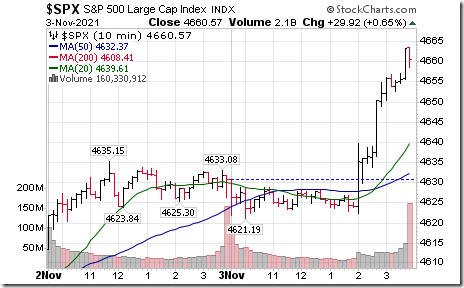
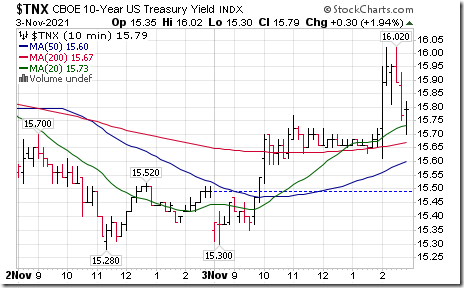
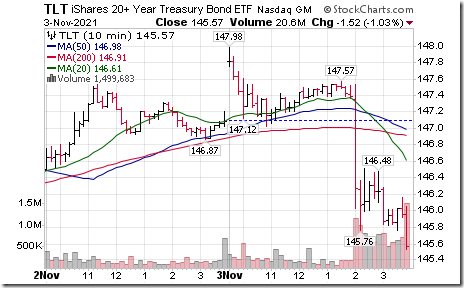
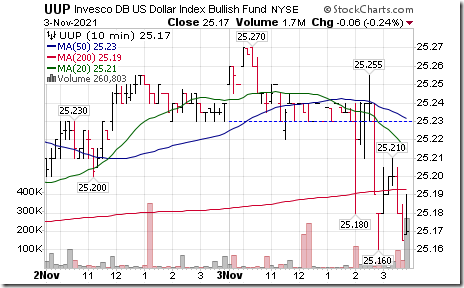
The Federal Reserve decided to start tapering their bond purchases. Responses were as follows:
Broadly based U.S. equity indices moved higher.
Yield on 10 year Treasuries moved higher
Conversely, long term government bond prices moved lower
U.S. Dollar Index ETN moved lower
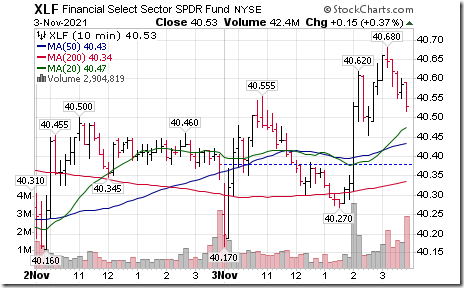
U.S. Financial stocks and related ETFs moved higher
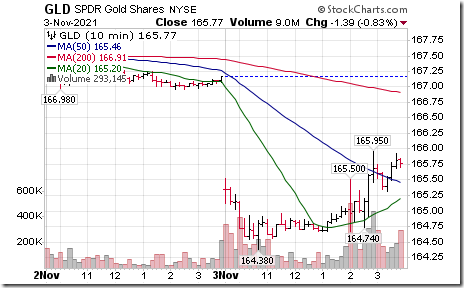
Gold moved higher
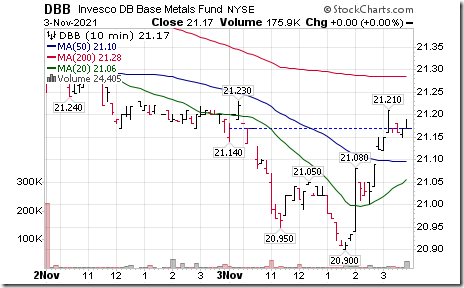
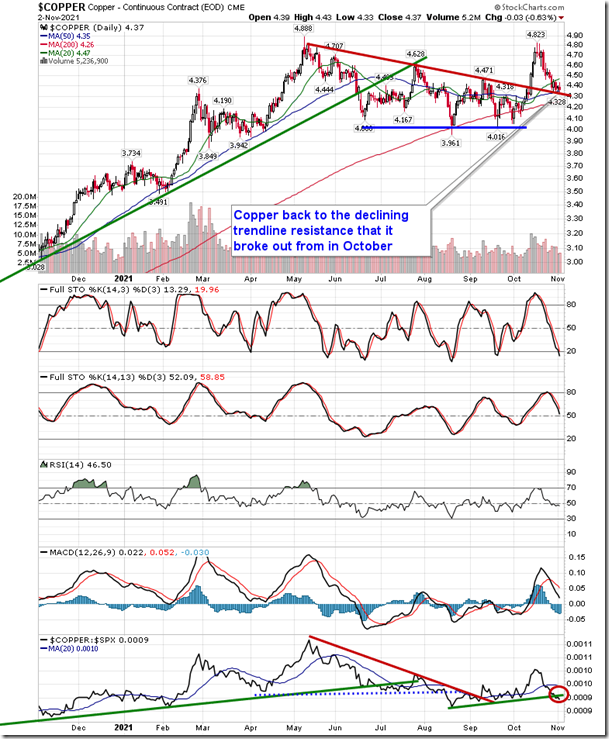
Base metals prices (copper, zinc, aluminum) rose sharply
Technical Notes released yesterday at
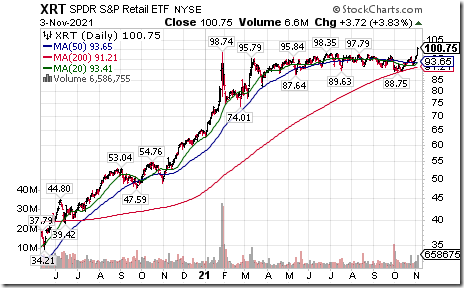
Retail SPDRs $XRT moved above $98.35 and $98.74 to an all-time high extending an intermediate uptrend.
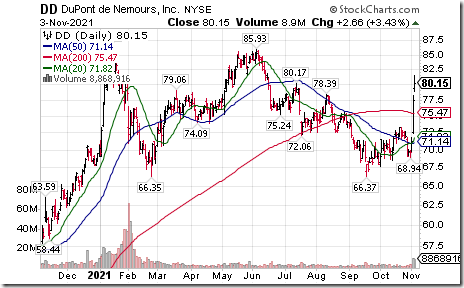
Dupont $DD an S&P 100 stock moved above $78.39 and $80.17 setting an intermediate uptrend. The stock was a focus yesterday on Cramer’s Mad Money
Watching the price of copper closely as it tests previous trendline resistance as support. equityclock.com/2021/11/02/… $CPER $COPX $HG_F $XME $FCX $UUP $USDX
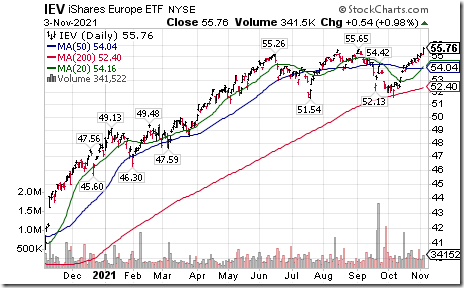
Europe iShares $IEV moved above $55.65 to an all-time high extending an intermediate uptrend.
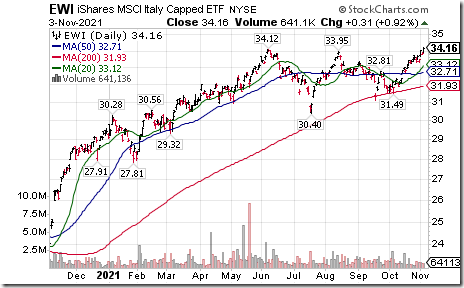
Italy iShares $EWI moved above $34.12 to an all-time high extending an intermediate uptrend.
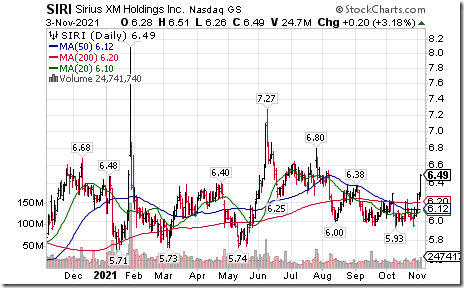
Sirius XM $SIRI a NASDAQ 100 stock moved above intermediate resistance at $6.38 . Seasonal influences on a real and relative basis are favourable until mid-January. If a subscriber to equityclock.com/ See: charts.equityclock.com/siri…
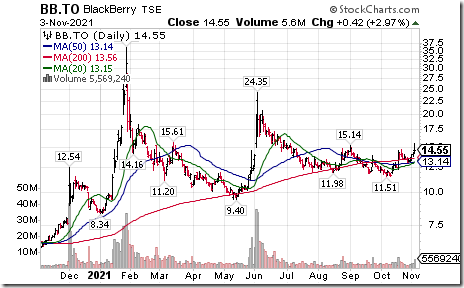
Blackberry $BB.CA a TSX 60 stock moved above intermediate resistance at Cdn$15.14. Seasonal influences on a real and relative basis are strongly positive to the end of January. If a subscriber to equityclock.com/. see charts.equityclock.com/blac…
Trader’s Corner
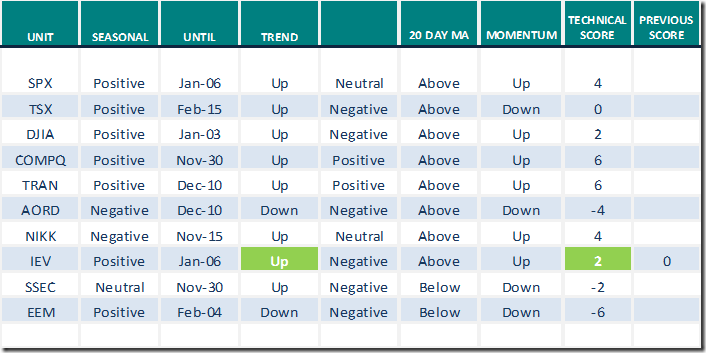
Equity Indices and Related ETFs
Daily Seasonal/Technical Equity Trends for Nov.3rd 2021
Green: Increase from previous week
Red: Decrease from previous week
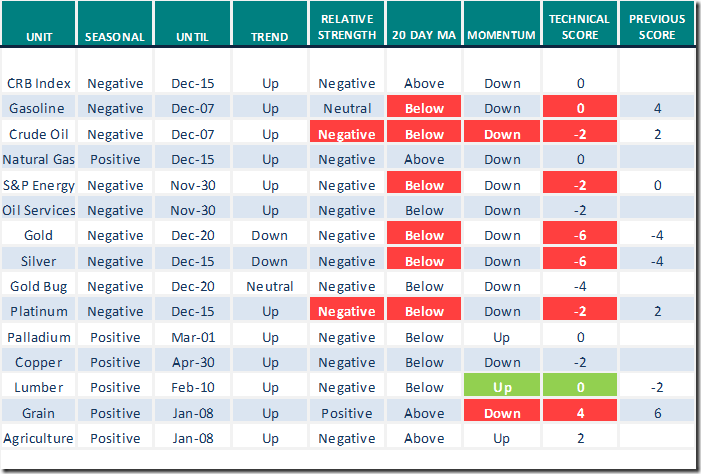
Commodities
Daily Seasonal/Technical Commodities Trends for Nov.3rd 2021
Green: Increase from previous week
Red: Decrease from previous week
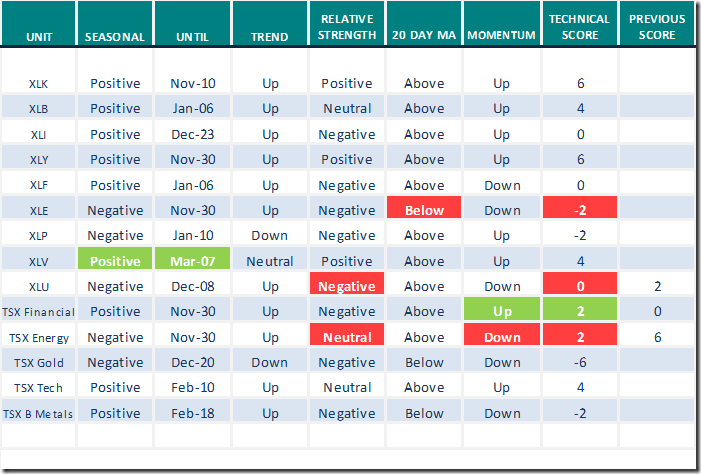
Sectors
Daily Seasonal/Technical Sector Trends for Nov.3rd 2021
Green: Increase from previous week
Red: Decrease from previous week
All seasonality ratings are based on performance relative to the S&P 500 Index (except TSX)
Links from Valued Providers
Thank you to Mark Bunting and www.uncommonsenseinvestor.com for a link to the following comments and videos.
Five Factors Bearish Strategist Admits Could Drive S&P 500 Higher by 36% – Uncommon Sense Investor
Gregg Schnell is “Prepping for the 2022 Energy Rally” Following is a link:
Prepping For The 2022 Energy Rally | Greg Schnell, CMT | Market Buzz (11.03.21) – YouTube
Editor’s Note: Seasonal influences on a real and relative basis for the energy sector normally bottom in U.S. and Canadian equity indices at the end of November for a seasonal trade lasting until late April. If a subscriber to www.EquityClock.com see:
https://charts.equityclock.com/ishares-sptsx-capped-energy-index-etf-tsexeg-seasonal-chart and
https://charts.equityclock.com/energy-select-sector-spdr-fund-nysexle-seasonal-chart
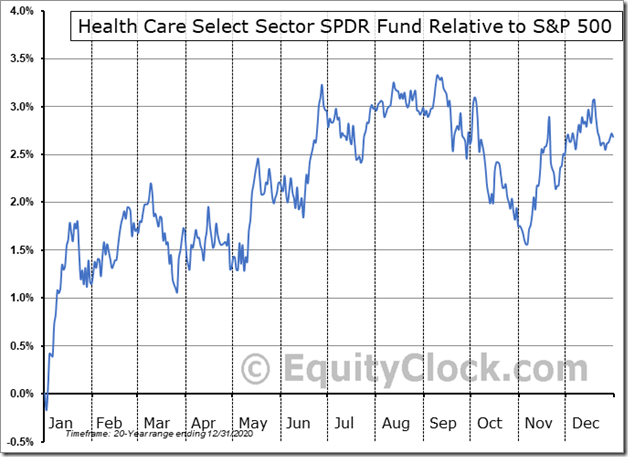
Seasonality Chart of the Day from www.EquityClock.com
Seasonal influences on a real and relative basis turn favourable in early November and remain favourable until at least January 20th and frequently to March 10th
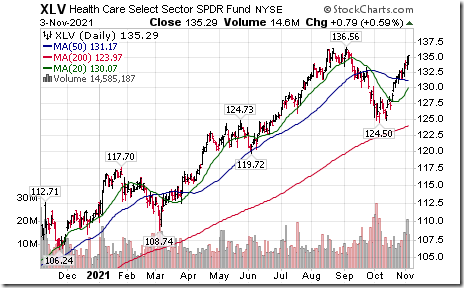
XLV has an improving technical profile. It currently is in an intermediate uptrend. Strength relative to the S&P 500 is positive. Units recently moved above their 20 and 50 day moving averages. A move to an all-time high above $136.56 will attract trader attention.
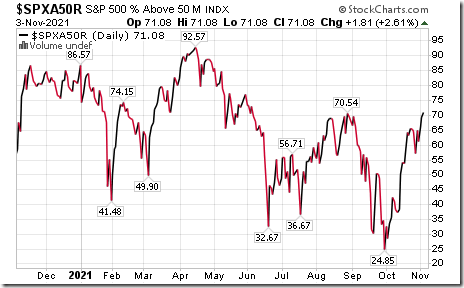
S&P 500 Momentum Barometers
The intermediate term Barometer added another 1.81 to 71.08 yesterday. It remains Overbought and continues to trend higher.
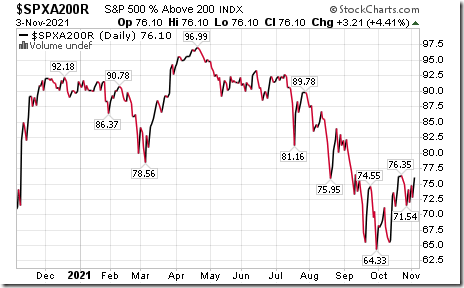
The long term Barometer added 3.21 to 3.21 to 76.10 yesterday. It remains Overbought.
TSX Momentum Barometers
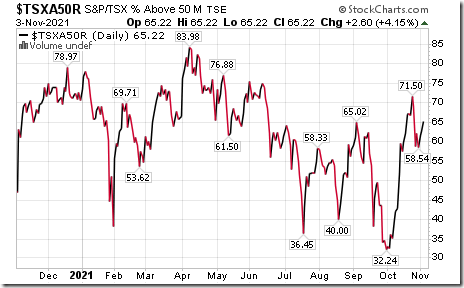
The intermediate term Barometer gained 2.60 to 65.22 yesterday. It remains Overbought.
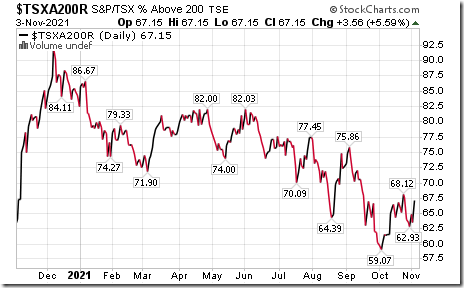
The long term Barometer added 3.56 to 67.15 yesterday. It remains Overbought.
Disclaimer: Seasonality and technical ratings offered in this report and at
www.equityclock.com are for information only. They should not be considered as advice to purchase or to sell mentioned securities. Data offered in this report is believed to be accurate, but is not guaranteed
This post was originally publised at Vialoux's Tech Talk.


