by Don Vialoux, EquityClock.com
The Bottom Line
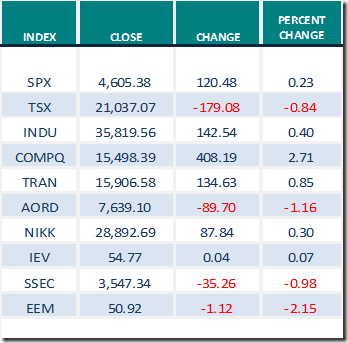
Broadly based U.S. equity indices moved higher while other developed world equity indices were mixed last week. Seasonal influences for broadly based equity indices turned favourable as usual in mid-October and usually remain positive until the first week in January.
Observations
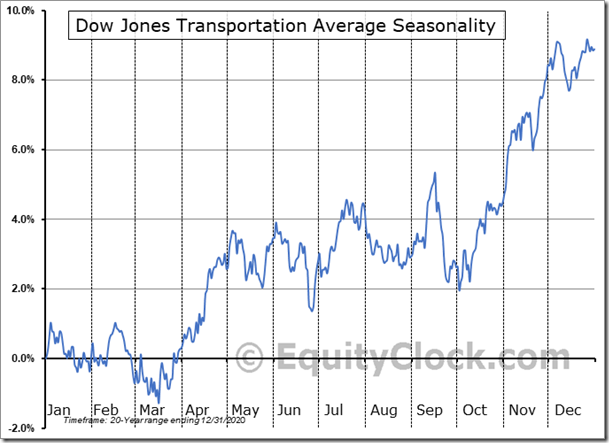
Favourable seasonal influences on broadly based U.S. equity indices were extended last week. The S&P 500 Index and Dow Jones Industrial Average closed at all-time closing highs. Strength in North American equity indices continued as expected during their strongest twelve week period of the year from mid-October to the the first week in January. Strongest broadly based U.S. equity index last week once again was the Dow Jones Transportation Average.
Short term short term indicators for U.S. equity indices and sectors (20 day moving averages, short term momentum indicators) were mixed last week.
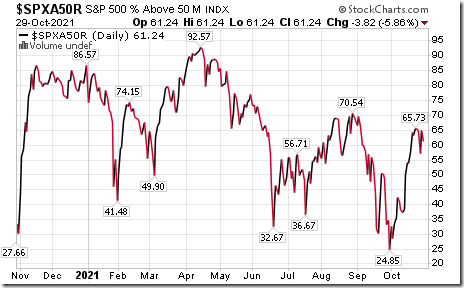
Intermediate term technical indicator for U.S. equity markets (Percent of S&P 500 stocks trading above their 50 day moving average) moved slightly lower last week. It remained Overbought. See Barometer chart at the end of this report.
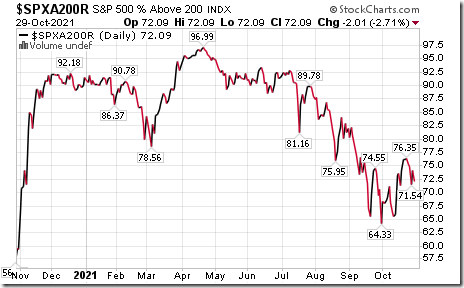
Long term technical indicator for U.S. equity markets (Percent of S&P 500 stocks trading above their 200 day moving average) moved slightly lower last week. It remained Overbought. See Barometer chart at the end of this report.
Short term momentum indicators for Canadian indices and sectors moved slightly lower last week.
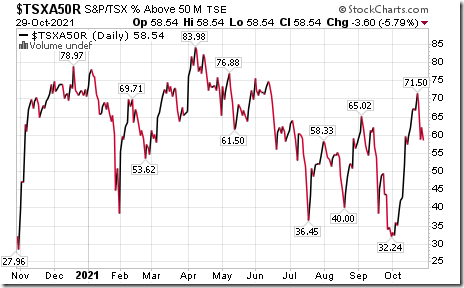
Intermediate term technical indicator for Canadian equity markets moved slightly lower last week. It changed from Overbought to Neutral.. See Barometer chart at the end of this report.
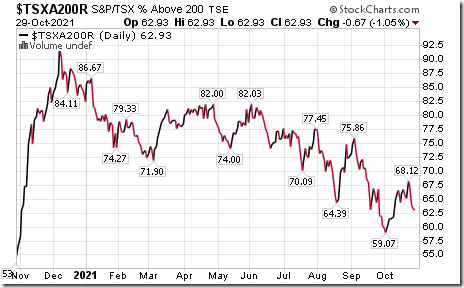
Long term technical indicator for Canadian equity markets (Percent of TSX stocks trading above their 200 day moving average) moved slightly lower last week. It remained Overbought. See Barometer charts at the end of this report.
Economic News This Week
September Construction Spending to be released at 10:00 AM EDT on Monday is expected to increase 0.4% versus a gain of 0.3% in August.
October Manufacturing ISM to be released at 10:00 AM EDT on Monday is expected to slip to 60.4 from 61.1 in September.
October ADP Employment report to be released at 8:15 AM EDT on Wednesday is expected to show a gain of 369,000 versus a gain of 568,000 in September.
October Non-Manufacturing ISM to be released at 10:00 AM EDT on Wednesday is expected to slip to 61.5 from 61.9 in September.
September Factory Orders to be released at 10:00 AM EDT on Wednesday are expected to slip 0.1% versus a gain of 1.2% in August.
FOMC statement on interest rates to be released at 2:00 AM EDT on Wednesday is expected to maintain the Fed Fund Rate at 0.00-0.25%. An update on timing for tapered purchases is expected to be released. Press conference with Chairman Powell is scheduled at 2:30 PM EDT.
September U.S. Trade Deficit to be released at 8:30 AM EDT on Thursday is expected to increase to $74.10 billion from $73.3 billion.
September Canadian Merchandise Trade to be released at 8:30 AM EDT on Thursday is expected to be a surplus of $0.43 billion versus a surplus of $1.94 billion in August.
October Non-farm Payrolls to be released at 8:30 AM EDT on Friday are expected to increase 385,000 versus a gain of 194,000 in September. The October Unemployment Rate is expected to remain at 4.8% set in September. October Hourly Earnings are expected to increase 0.4% versus a gain of 0.6% in September.
October Canadian Employment to be released at 8:30 AM EDT on Friday is expected to increase 65,000 versus a gain of 157,100 in September. October Unemployment Rate is expected to remain at 4.8% set in September.
Consensus estimates for earnings and revenues in 2021 by S&P 500 companies were raised again last week following the release of better than consensus third quarter results by another 165 S&P 500 companies. According to www.FactSet.com earnings in the third quarter on a year-over year basis are projected to increase 36.6% (versus a previous estimate at 32.7% last week) and revenues are projected to increase 15.8% (versus a previous estimate at 15.3%). Earnings in the fourth quarter are projected to increase 21.6% (versus 22.4% last week) and revenues are projected to increase 11.9%. Earnings for all of 2021 are projected to increase 44.4% (versus 44.1% last week) and revenues are projected to increase 15.2%.
Consensus estimates for earnings and revenue growth in 2022 were adjusted slightly lower. Consensus earnings for the first quarter are projected to increase 5.8% (versus 6.2% last week) and revenues are expected to increase 8.6%. Consensus earnings in 2022 by S&P 500 companies are projected to increase 8.6% (versus 9.5% last week) and revenues are projected to increase 6.9% (versus 6.8% last week)
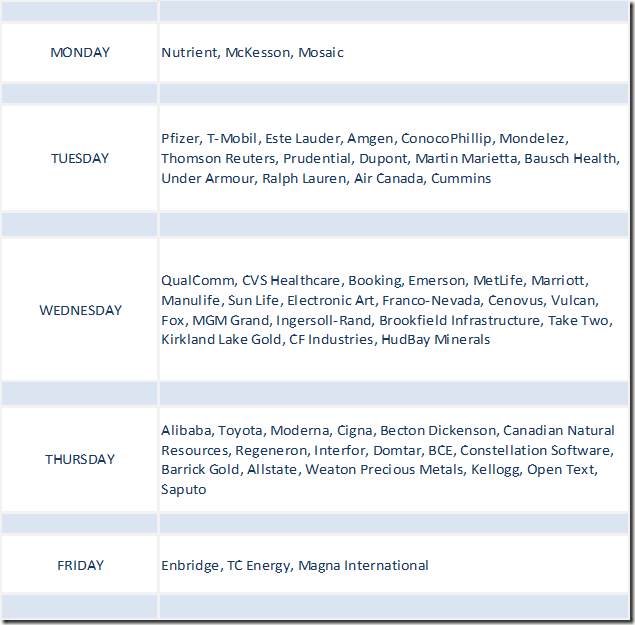
Selected Earnings Reports This Week
Another 169 S&P 500 companies (including one Dow Jones Industrial Average company) are scheduled to report quarterly results this week. Release of quarterly results by TSX 60 companies reaches a peak this week.
Trader’s Corner
Equity Indices and Related ETFs
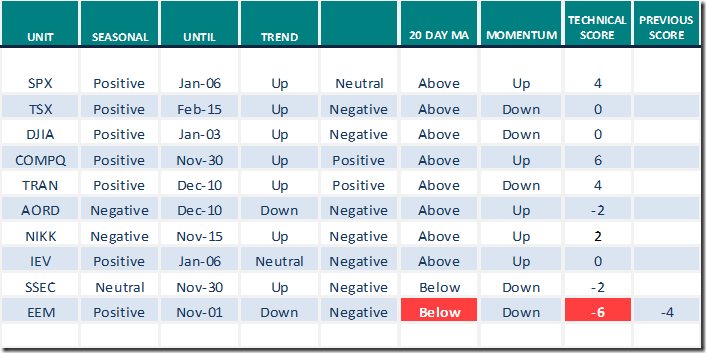
Daily Seasonal/Technical Equity Trends for Oct.29th 2021
Green: Increase from previous week
Red: Decrease from previous week
Commodities
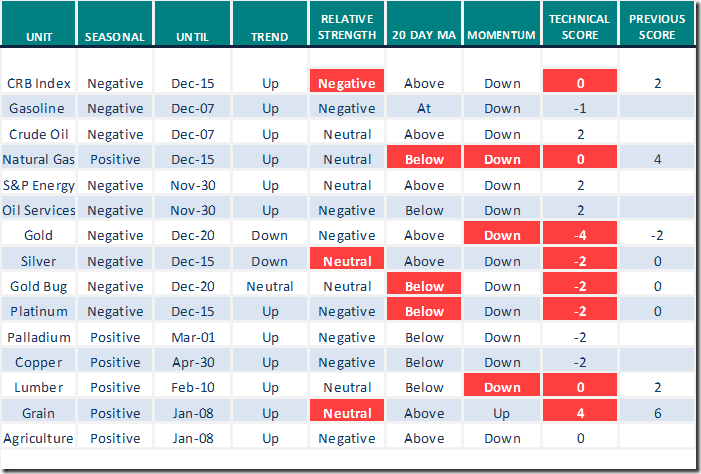
Daily Seasonal/Technical Commodities Trends for Oct.29th 2021
 Green: Green: Increase from previous week
Red: Decrease from previous week
Sectors
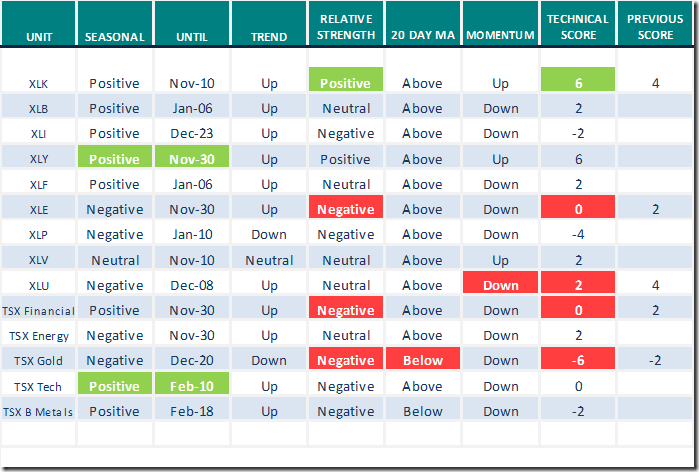
Daily Seasonal/Technical Sector Trends for Oct.29th 2021
Green: Increase from previous week
Red: Decrease from previous week
All seasonality ratings are based on performance relative to the S&P 500 Index (except TSX)
Links from Valued Providers
Links from Valued Providers
Thank you to Mark Bunting and www.uncommoninvestor.com for links to the following:
Four Growth Stocks in the Electric Vehicle Supply Chain – Uncommon Sense Investor
Why the Oil Party Has Just Begun
Pricey Lumber Is Back Boosted by Supply Cuts, Labor Shortage (yahoo.com)
Michael Campbell’s Money Talks for October 30th
October 30th Episode (mikesmoneytalks.ca)
Arthur Hill says” Trend indicator turns bullish for IWM: What should we expect”?
Trend Indicator Turns Bullish for IWM: What should we Expect? | ChartWatchers | StockCharts.com
Greg Schnell notes, “The EV World Lights Up on Tesla’s Order”
The EV World Lights Up on Tesla’s Order | ChartWatchers | StockCharts.com
The Pitch: Four Buys and One Scary Idea
New Dow Theory Buy Signal from David Keller
New Dow Theory Buy Signal | David Keller, CMT | The Final Bar (10.29.21) – YouTube
Strong seasonal trends for November by Julius de Kempenaer
Strong Seasonal Trends For November | Julius de Kempenaer (10.26.21) – YouTube
Thank you to David Chapman and www.EnrichedInvesting.com for a link to their weekly Technical Scoop
Technical Scores
Calculated as follows:
Intermediate Uptrend based on at least 20 trading days: Score 2
(Higher highs and higher lows)
Intermediate Neutral trend: Score 0
(Not up or down)
Intermediate Downtrend: Score -2
(Lower highs and lower lows)
Outperformance relative to the S&P 500 Index: Score: 2
Neutral Performance relative to the S&P 500 Index: 0
Underperformance relative to the S&P 500 Index: Score –2
Above 20 day moving average: Score 1
At 20 day moving average: Score: 0
Below 20 day moving average: –1
Up trending momentum indicators (Daily Stochastics, RSI and MACD): 1
Mixed momentum indicators: 0
Down trending momentum indicators: –1
Technical scores range from -6 to +6. Technical buy signals based on the above guidelines start when a security advances to at least 0.0, but preferably 2.0 or higher. Technical sell/short signals start when a security descends to 0, but preferably -2.0 or lower.
Long positions require maintaining a technical score of -2.0 or higher. Conversely, a short position requires maintaining a technical score of +2.0 or lower
Changes Last Week
Technical Notes for Friday released at
StockTwits.com@EquityClock
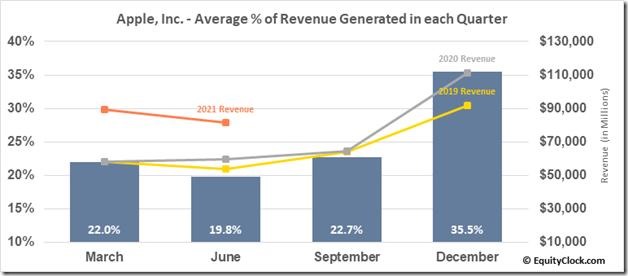
Shares of $AAPL trading lower following an earnings miss, citing the supply chain disruptions that are expected to persist through the fourth quarter. The last quarter of the year typically delivers more than third of Apple’s annual revenue, making this an unfortunate time to be burdened.
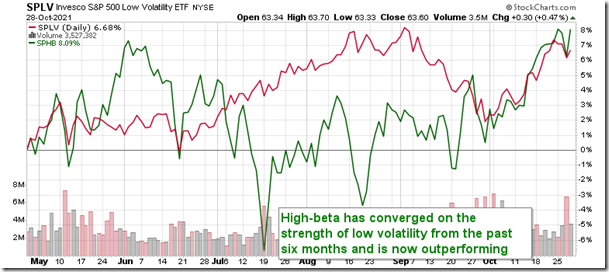
High Beta is back on an outperforming path versus Low Volatility, conducive to a risk-on bias in the market. equityclock.com/2021/10/28/… $SPHB $SPLV $SPX $SPY
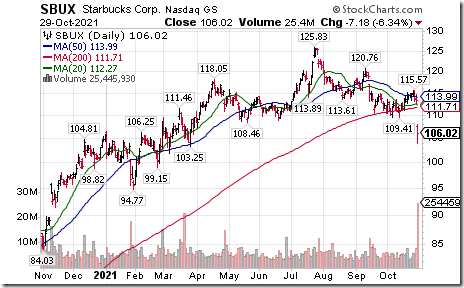
Starbucks $SBUX a Dow Jones Industrial Average stock moved below $109.41 completing a Head & Shoulders pattern.
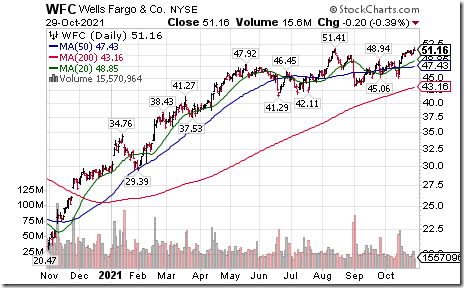
Wells Fargo $WFC an S&P 100 stock moved above $51.41 extending an intermediate uptrend.
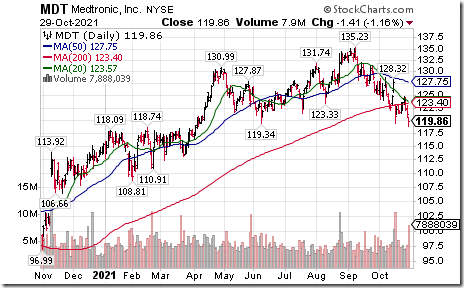
Medtronic $MDT an S&P 100 stock moved below $119.34 extending an intermediate downtrend.
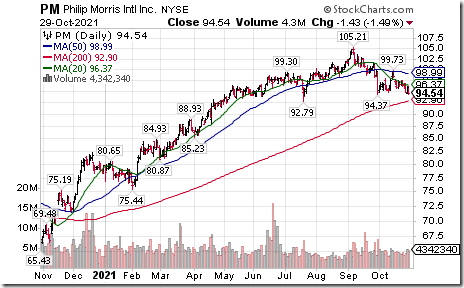
Philip Morris International $PM an S&P 100 stock moved below $94.37 completing a Head & Shoulders pattern
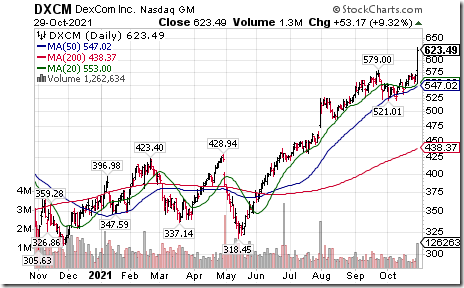
DexCom $DXCM a NASDAQ 100 stock moved above $579.00 to an all-time high extending an intermediate uptrend.
Editor’s Note: Seasonal influences relative to the S&P 500 Index are negative until the end of January. If a subscriber to www.EquityClock.com, see seasonality chart at
https://charts.equityclock.com/dexcom-inc-nasddxcm-seasonal-chart
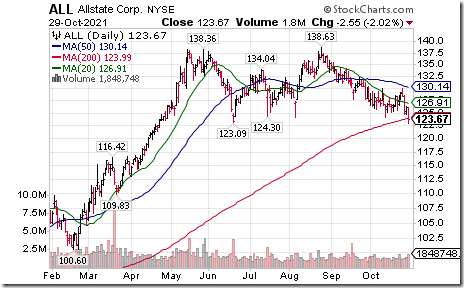
Allstate $ALL an S&P 100 stock moved below $123.09 completing a double top pattern.
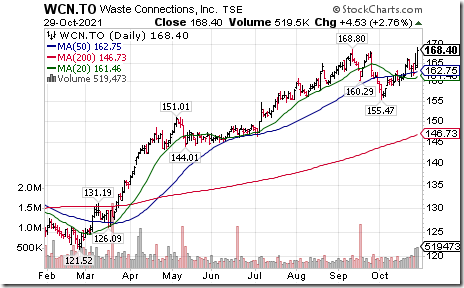
Waste Connections $WCN.CA a TSX 60 stock moved above $168.80 to an all-time high extending an intermediate uptrend.
Editor’s Note: Seasonal influences relative to the S&P 500 Index are negative until the end of January. If a subscriber to www.EquityClock.com, see seasonality chart at https://charts.equityclock.com/waste-connections-tsewcn-seasonal-chart
S&P 500 Momentum Barometers
The intermediate Barometer slipped 3.82 on Friday and 4.49 last week to 61.24. It remains Overbought.
The long term Barometer eased 2.01 on Friday and 4.26 last week to 72.09. It remains Overbought.
TSX Momentum Barometers
The intermediate term Barometer slipped 3.60 on Friday and 8.13 last week to 58.54. It changed from Overbought to Neutral on a drop below 60.00.
The long term Barometer eased 0.67 on Friday and 2.29 last week to 62.93. It remains Overbought.
Disclaimer: Seasonality and technical ratings offered in this report and at
www.equityclock.com are for information only. They should not be considered as advice to purchase or to sell mentioned securities. Data offered in this report is believed to be accurate, but is not guaranteed
This post was originally publised at Vialoux's Tech Talk.


