by Don Vialoux, EquityClock.com
Technical Notes released yesterday at
Frontier iShares $FM moved above $34.80 to an all-time high extending an intermediate uptrend.
Editor’s Note: Seasonal influences are favourable on a real and relative basis between now and the third week in February. See:
https://charts.equityclock.com/ishares-msci-frontier-100-etf-amexfm-seasonal-chart
Access to seasonality charts is available by subscription at www.EquityClock.com
Uranium ETF $URA moved above $28.72 to an all-time high extending an intermediate uptrend. Responding to strength in Cameco $CCJ and spot uranium prices.
Canadian forest product stocks continue to move higher. Canfor $CFP.CA moved above $29.11, $29.28 and $29.37 resuming an intermediate uptrend. Forest product ETFs including $WOOD and $CUT also are moving higher.
Editor’s Note: Seasonal influences are favourable on a real and relative basis for lumber futures, lumber stocks and lumber ETFs between now and at least early January and frequently to mid-February. See:
https://charts.equityclock.com/seasonal_charts/CFP.TO_RelativeToSPX.png
Access to seasonality charts is available by subscription at www.EquityClock.com
Splunk $SPLK a NASDAQ 100 stock moved above $160.00 extending an intermediate uptrend.
Loblaw Companies $L.CA a TSX 60 stock moved above $91.62 to an all-time high extending an intermediate uptrend
Editor’s Note: Seasonal influences are favourable on a real basis between now and December 31st. See:
https://charts.equityclock.com/loblaw-companies-limited-tsel-seasonal-chart
Access to seasonality charts is available by subscription at www.EquityClock.com
Trader’s Corner
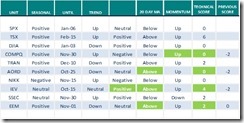
Equity Indices and Related ETFs
Daily Seasonal/Technical Equity Trends for Oct.13th 2021
Green: Increase from previous day
Red: Decrease from previous day
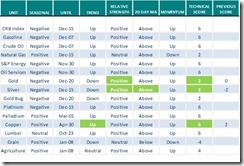
Commodities
Daily Seasonal/Technical Commodities Trends for Oct.13th 021
Green: Increase from previous day
Red: Decrease from previous day
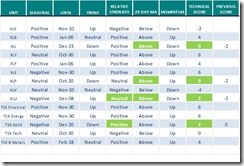
Sectors
Daily Seasonal/Technical Sector Trends for Oct.13th 2021
Green: Increase from previous day
Red: Decrease from previous day
All seasonality ratings are based on performance relative to the S&P 500 Index (except TSX)
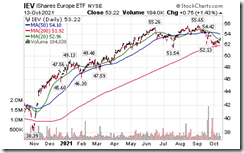
Seasonality Chart of the Day from www.EquityClock.com
Seasonal influences on a real basis for IEV are favourable until early January.
Technical score increased yesterday from -2 to +4 when strength relative to the S&P 500 changed from Negative to Positive and units moved above their 20 day moving average.
Links to videos from valued contributors
Greg Schnell discusses tricky technical markets. His comments include favourable comments on crude oil, oil stocks, lumber and lumber stocks. Following is a link:
The Markets Are Tricky Technically | Greg Schnell, CMT | Market Buzz (10.13.21) – YouTube
Dave Keller discusses “Where to place bets through year end” Following is the link:
Where to Place Bets Through Year End | David Keller, CMT | The Final Bar (10.12.21) – YouTube
Larry Williams says “Trick or Treat Comes to Wall Street”. Focus is on seasonal patterns and how they turn bullish by the end of October. Following is the link:
Trick or Treat Comes To Wall Street | Larry Williams (10.12.21) – YouTube
S&P 500 Momentum Barometers
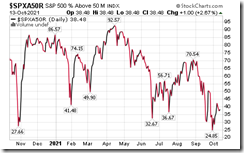
The intermediate term Barometer added 1.00 to 38.48 yesterday. It remains Oversold.
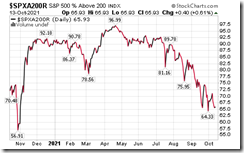
The long term Barometer added 0.40 to 65.93 yesterday. It remains Overbought.
TSX Momentum Barometers
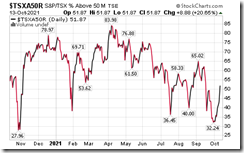
The intermediate term Barometer advanced 8.88 to 51.87 yesterday. It remains Neutral and trending higher.
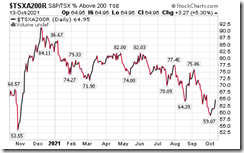
The long term Barometer added 3.27 to 64.95 yesterday. It remains Overbought and trending higher.
Disclaimer: Seasonality and technical ratings offered in this report and at
www.equityclock.com are for information only. They should not be considered as advice to purchase or to sell mentioned securities. Data offered in this report is believed to be accurate, but is not guaranteed
This post was originally publised at Vialoux's Tech Talk.


