by Don Vialoux, EquityClock.com
TECHNICAL NOTES released yesterday at
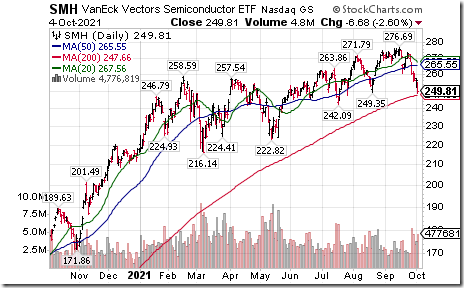
Semiconductor ETF $SMH moved below intermediate support at $249.35.
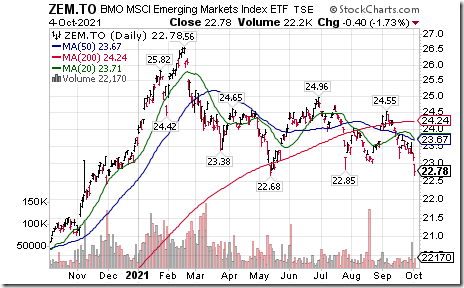
BMO Emerging Markets ETF $ZEM.CA moved below Cdn$22.68 extending an intermediate downtrend.
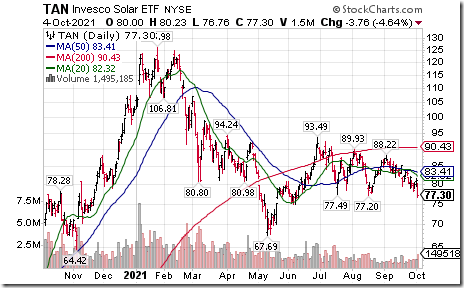
Solar ETF $TAN moved below intermediate support at $77.20
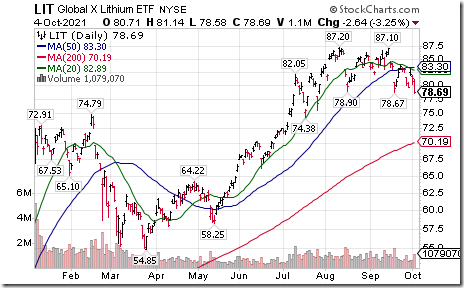
Lithium ETN $LIT moved below $78.67 completing a double top pattern.
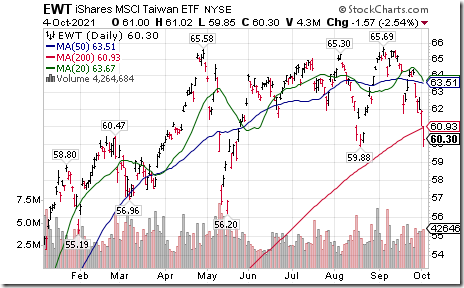
Taiwan iShares $EWT moved below intermediate support at $59.88
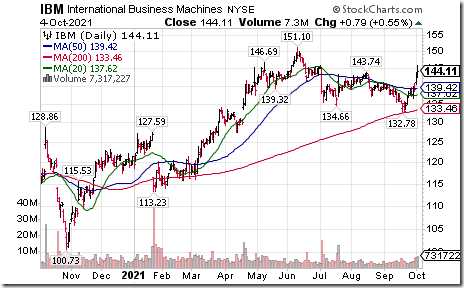
IBM $IBM a Dow Jones Industrial Average stock moved above intermediate resistance at $143.74.
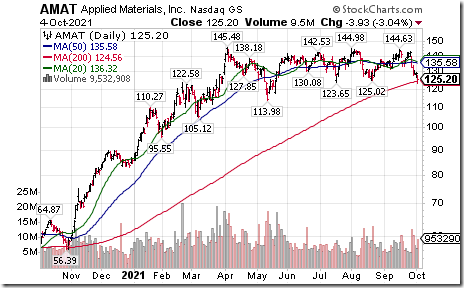
Applied Materials $AMAT a NASDAQ 100 stock moved below $125.02 completing a double top pattern
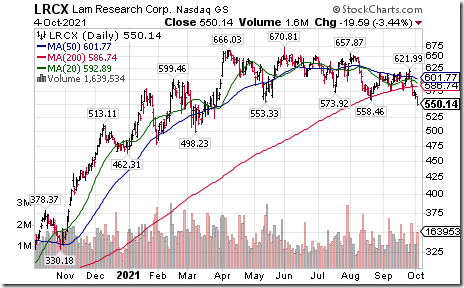
Lam Research $LRCX a NASDAQ 100 stock moved below $553.33 completing a double top pattern.
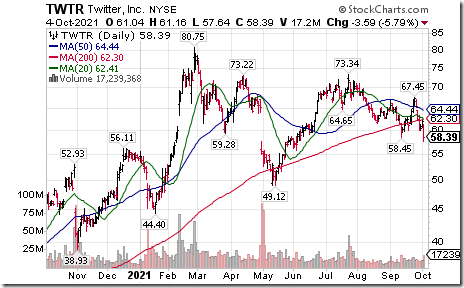
Twitter $TWTR a NASDAQ 100 stock moved below intermediate support at $58.45
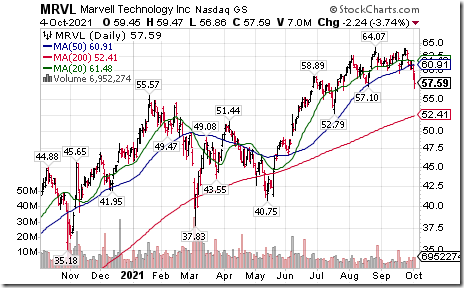
Marvell Technology $MRVL a NASDAQ 100 stock moved below intermediate support at $57.10
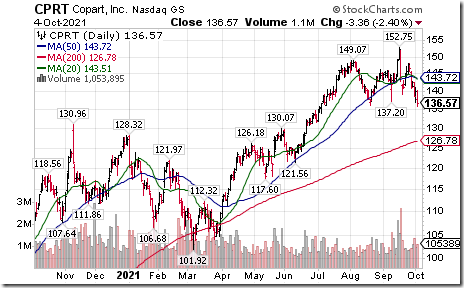
Copart $CPRT a NASDAQ 100 stock moved below $136.24 completing a double top pattern.
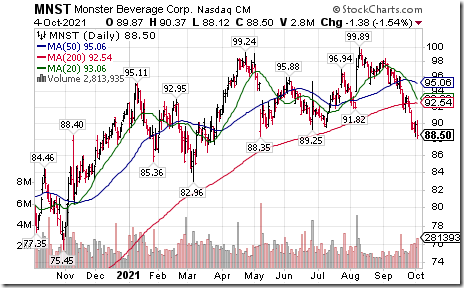
Monster Beverages $MNST moved below $88.35 completing a double top pattern.
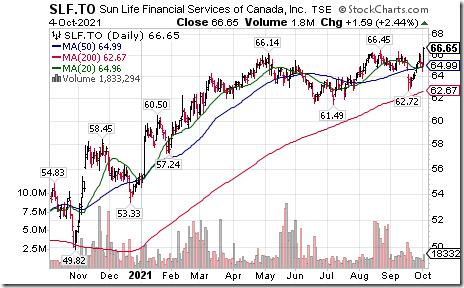
SunLife $SLF.CA a TSX 60 stock moved above $66.45 to an all-time high extending an intermediate uptrend. The company announced an acquisition this morning.
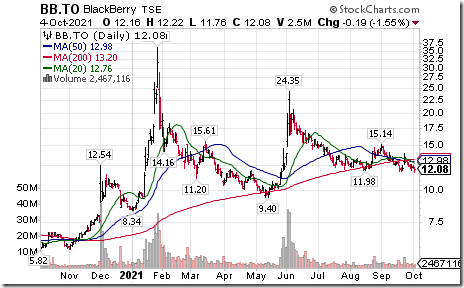
BlackBerry $BB.CA a TSX 60 stock moved below intermediate support at Cdn$11.98.
TRADER’S CORNER
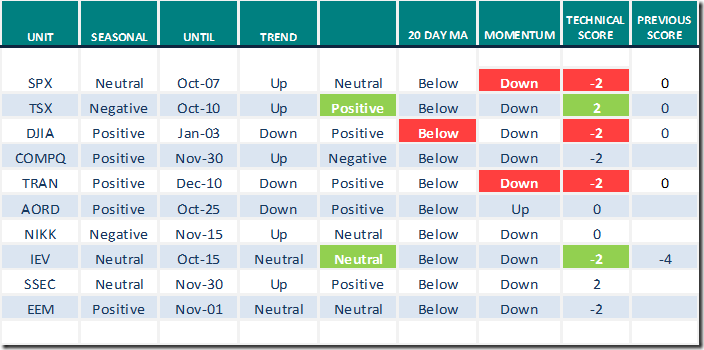
Equity Indices and Related ETFs
Daily Seasonal/Technical Equity Trends for Oct.4 2021
Green: Increase from previous day
Red: Decrease from previous day
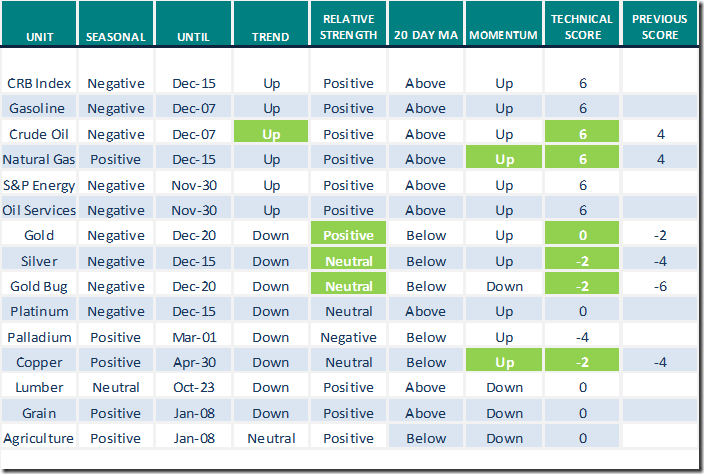
Commodities
Daily Seasonal/Technical Commodities Trends for Oct.4 2021
Green: Increase from previous day
Red: Decrease from previous day
Sectors
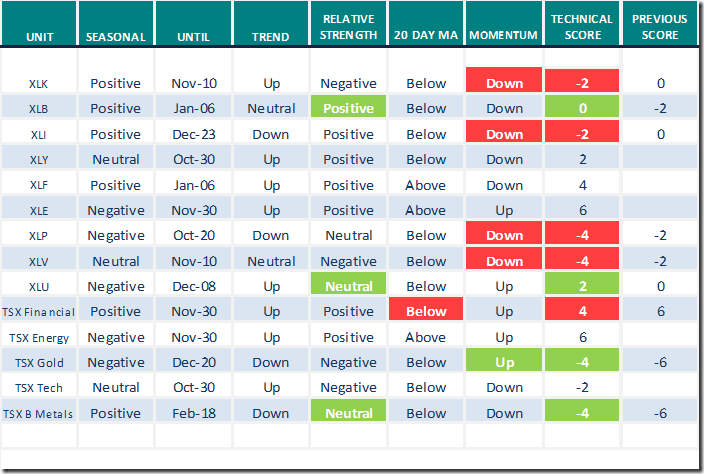
Daily Seasonal/Technical Sector Trends for Oct.4 2021
Green: Increase from previous day
Red: Decrease from previous day
All seasonality ratings are based on performance relative to the S&P 500 Index
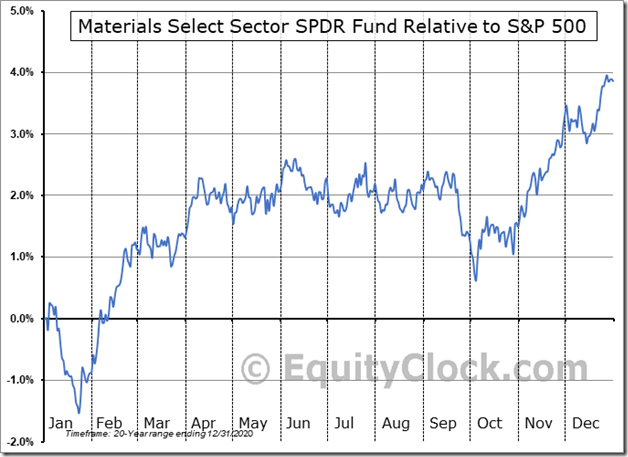
SEASONALITY CHART OF THE DAY from www.EquityClock.com
Materials SPDRs (XLB) have a history of bottoming on a real and relative basis on October 4th for a seasonal trade lasting to January 6th
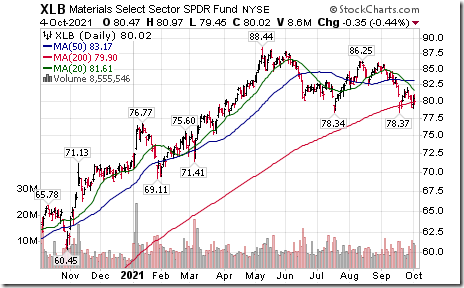
On the charts, XLB began to outperform the S&P 500 Index last week. Intermediate support is indicated at $78.34 and $78.37. A move above its 20 day moving average at $81.60 and short term resistance at $82.16 will confirm that favourable seasonal influences have started.
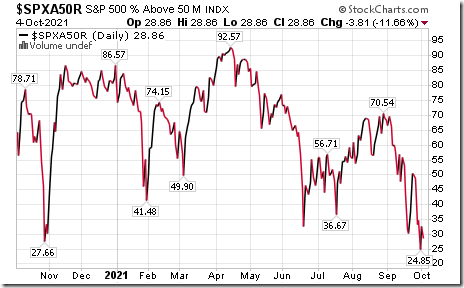
S&P 500 MOMENTUM BAROMETERS
The intermediate term Barometer dropped 3.81 to 28.86 yesterday. It remains Oversold.
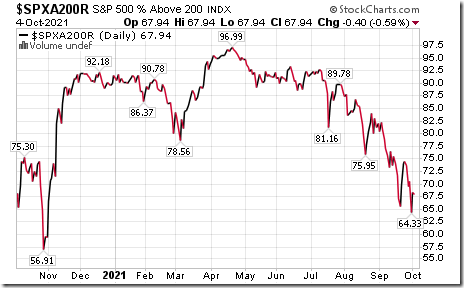
The long term Barometer slipped 0.40 to 67.94. It remains Overbought.
TSX MOMENTUM BAROMETERS
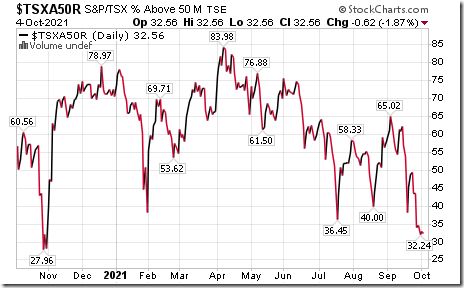
The intermediate term Barometer slipped 0.62 to 32.56 yesterday. It remains Oversold and trending down.
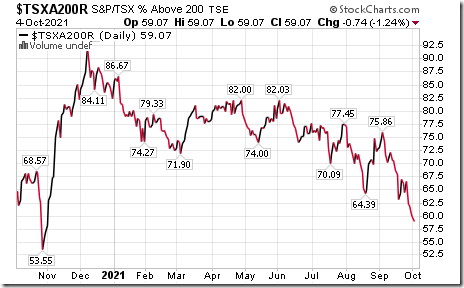
The long term Barometer eased 0.74 to 59.07 yesterday. It remains Neutral and trending down.
Disclaimer: Seasonality and technical ratings offered in this report and at
www.equityclock.com are for information only. They should not be considered as advice to purchase or to sell mentioned securities. Data offered in this report is believed to be accurate, but is not guaranteed
This post was originally publised at Vialoux's Tech Talk.


