by Don Vialoux, EquityClock.com
Technical Notes released yesterday at
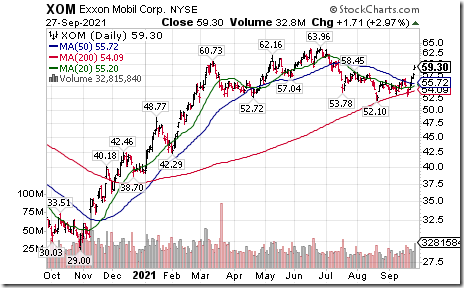
U.S. energy equities are leading U.S. equity markets on the upside this morning. Notable breakouts were $XOM on a move above $58.45 and $CVX on a move above $102.67
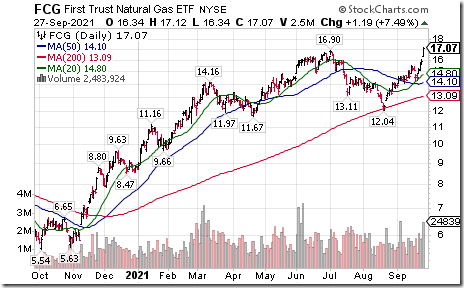
First Trust Natural Gas ETF $FCG moved above $16.90 to a three year high extending an intermediate uptrend. Responding to higher natural gas prices.
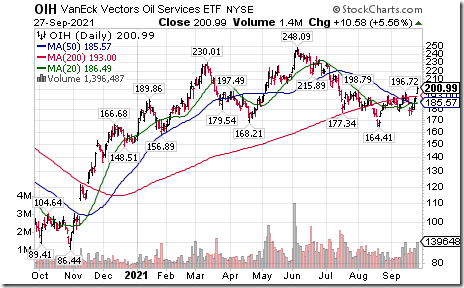
U.S. Oil Service stocks also are moving higher with rising crude oil prices. Oil services ETF $OIH moved above $19879 completing a reversal pattern.
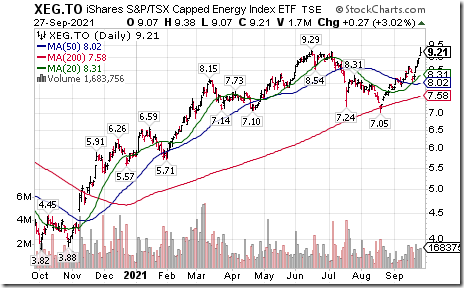
Canadian energy stocks and related ETFs are responding to higher crude oil and natural gas prices. Cdn. Energy iShares $XEG.CA moved above $9.29 extending an intermediate uptrend. BMO Equal Weight Cdn. Energy ETF $ZEO.CA moved above $44.33 extending an intermediate uptrend.
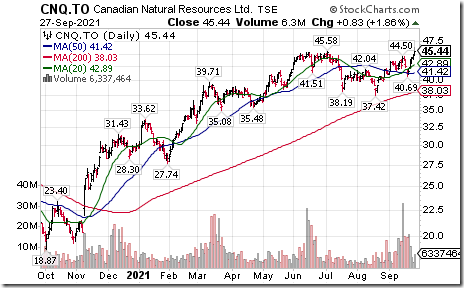
Canadian Natural Resources $CNQ.CA a TSX 60 stock moved above Cdn$45.58 extending an intermediate uptrend.
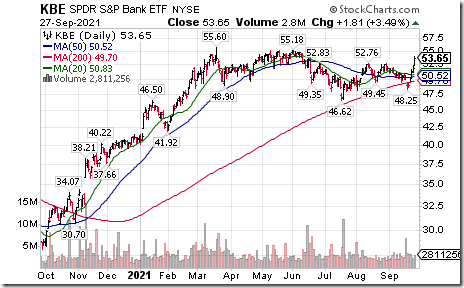
U.S. Big Center banks are responding to widening interest rate spreads. $KBE moved above $52.76 extending an intermediate uptrend. Bank of America $BAC moved above $43.27 extending an intermediate uptrend. MetlLfe moved above $63.08 extending an intermediate uptrend.
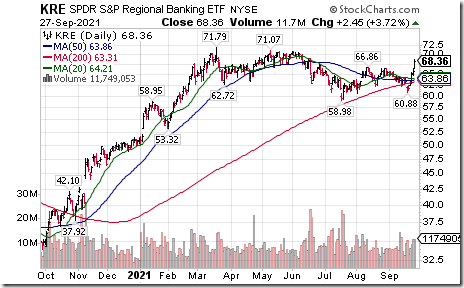
U.S. Regional Bank and related ETFs also are benefiting from increasing interest rate spreads. $KRE moved above $66.86 extending an intermediate uptrend.
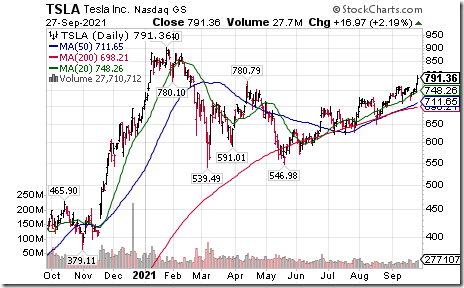
Tesla $TSLA a NASDAQ 100 stock moved above $780.79 extending an intermediate uptrend.
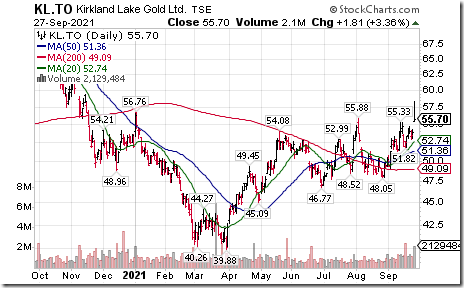
KIrkland Lake Gold $KL.CA a TSX 60 stock moved above Cdn $55.88 extending an intermediate uptrend.
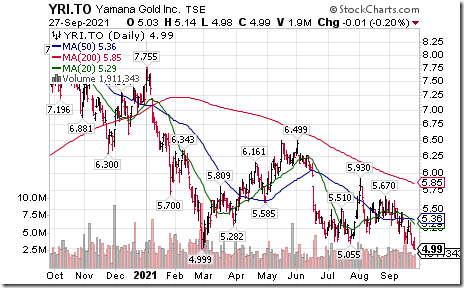
Canadian gold stocks remain under technical pressure. Yamana $YRI.CA a TSX 60 stock moved below Cdn$5.00 extending an intermediate downtrend.
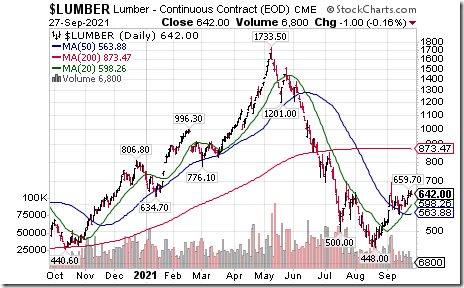
Canadian forest product stocks including $CFP.CA $IFP.CA and $WFG are notably higher today in response to higher lumber prices. Lumber futures will form a classic reverse Head & Shoulders pattern on a move above US$700. The season for start of strength in the sector normally is mid-October. Seasonal influences look like they are appearing earlier than usual this year
Trader’s Corner
Equity Indices and Related ETFs
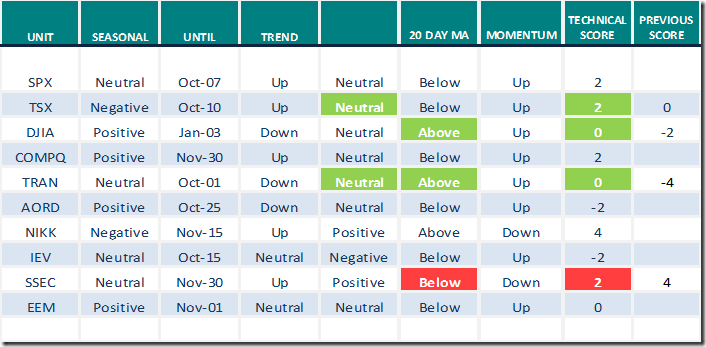
Daily Seasonal/Technical Equity Trends for September 27th 2021
Green: Increase from previous day
Red: Decrease from previous day
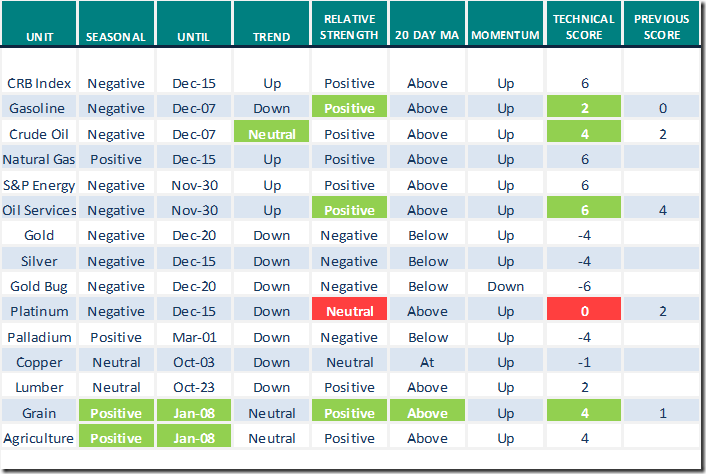
Commodities
Daily Seasonal/Technical Commodities Trends for September 27th 2021
Green: Increase from previous day
Red: Decrease from previous day
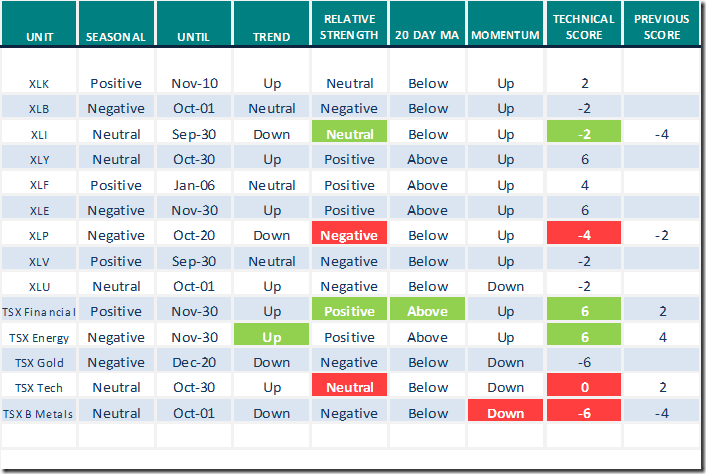
Sectors
Daily Seasonal/Technical Sector Trends for September 27th 2021
Green: Increase from previous day
Red: Decrease from previous day
All seasonality ratings are based on performance relative to the S&P 500 Index
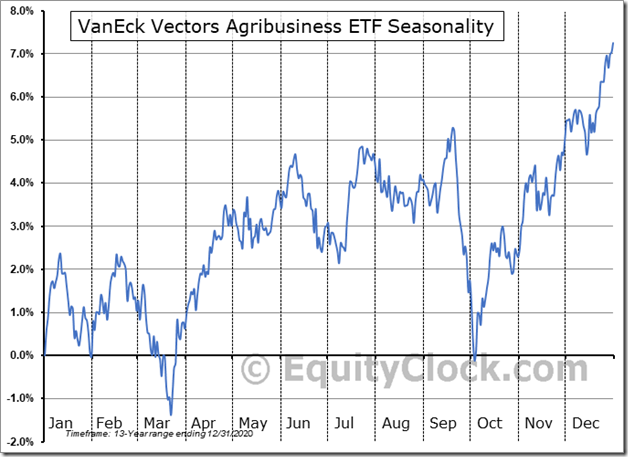
Seasonality Chart of the Day from www.EquityClock.com
Seasonal influences for grain prices (particularly soybeans and corn) and Agriculture ETFs (notably MOO in the U.S. and COW.TO on the TSX) are positive from October 1 to Jan.8th
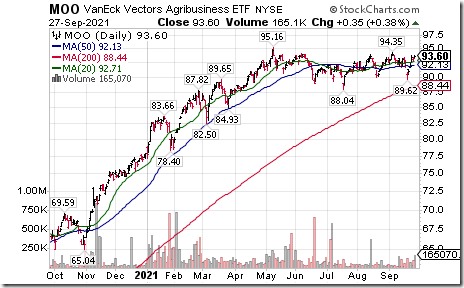
MOO and COW.TO have been trading in a tight trading range during the past six months. A move by MOO above $95.16 and COW.TO above Cdn$60.46 to all-time highs will attract trading interest. Short term momentum indicators and relative strength have turned positive.
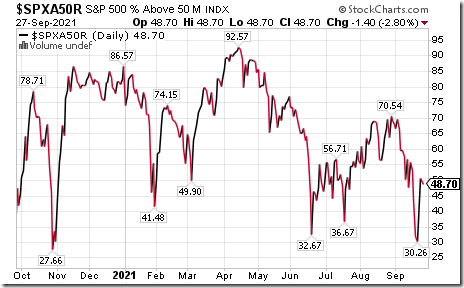
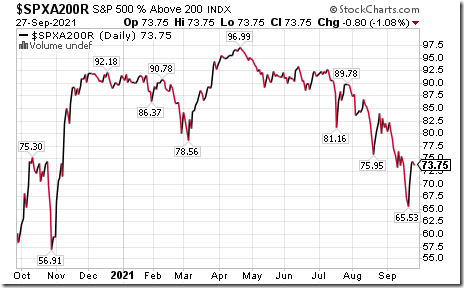
S&P 500 Momentum Barometers
The intermediate term Barometer slipped 1.40 to 48.70 yesterday. It remains Neutral.
The long term Barometer slipped 0.80 to 73.75 yesterday. It remains Overbought.
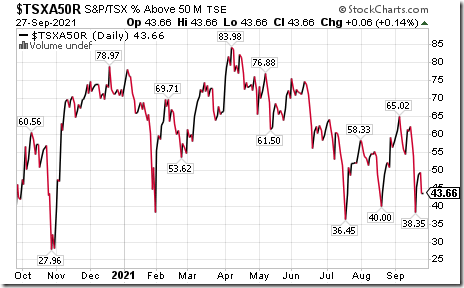
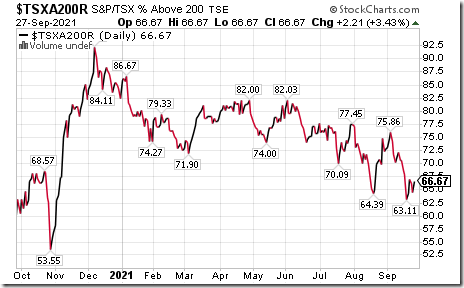
TSX Momentum Barometers
The intermediate term Barometer added 0.08 to 43.66 yesterday. It remains Neutral.
The long term Barometer added 2.21 to 66.67 yesterday. It remains Overbought.
Disclaimer: Seasonality and technical ratings offered in this report and at
www.equityclock.com are for information only. They should not be considered as advice to purchase or to sell mentioned securities. Data offered in this report is believed to be accurate, but is not guaranteed
This post was originally publised at Vialoux's Tech Talk.


