by Don Vialoux, EquityClock.com
StockTwits released yesterday at
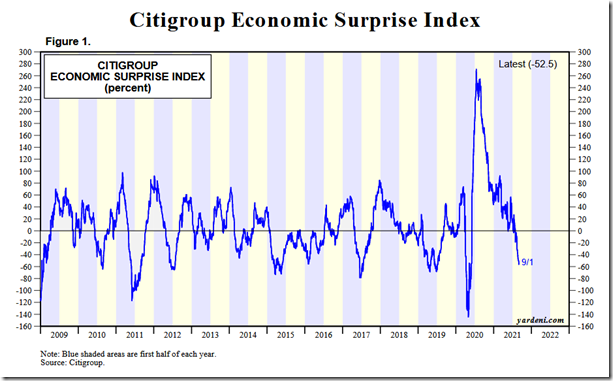
Economic data continues to miss expectations, resulting in the ongoing plunge in the Economic Surprise Index. equityclock.com/2021/09/01/… $SPX $STUDY $MACRO
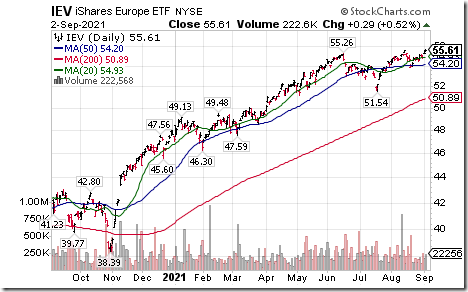
Europe iShares $IEV moved above $55.62 to an all-time high extending an intermediate uptrend.
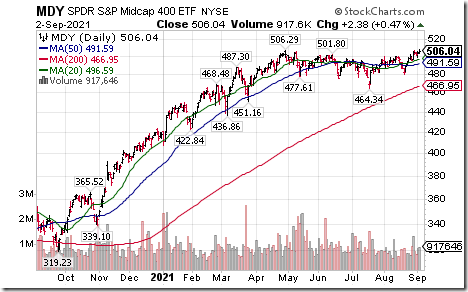
Mid-cap SPDRs $MDY moved above $506.29 to an all-time high extending an intermediate uptrend.
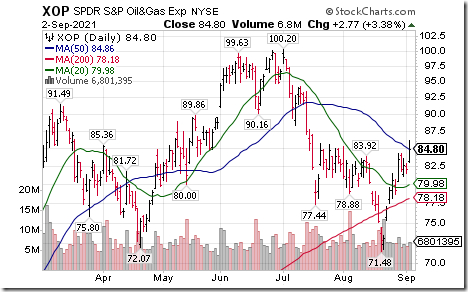
Oil and Gas Exploration SPDRs $XOP moved above intermediate resistance at $85.76.
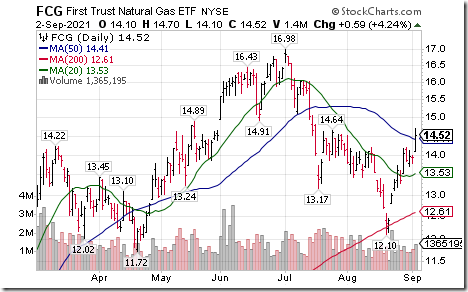
First Trust Natural Gas ETF $FCG moved above intermediate resistance at $14.64.
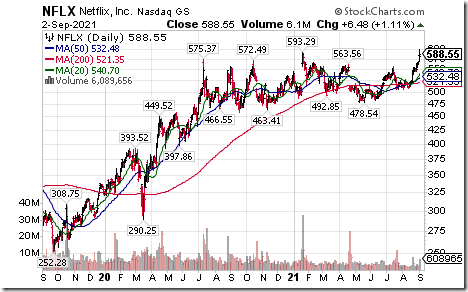
Netflix $NFLX a NASDAQ 100 stock moved above $593.29 to an all-time high extending an intermediate uptrend.
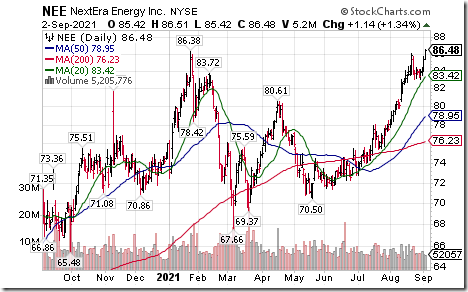
NextEra Energy $NEE an S&P 100 stock moved above $86.38 to an all-time high extending an intermediate uptrend.
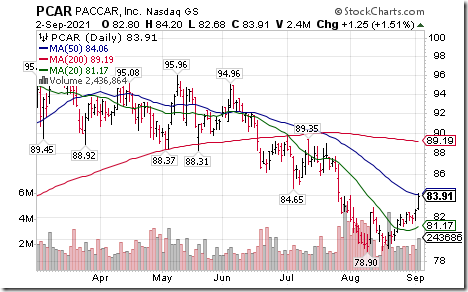
Paccar $PCAR an S&P 100 stock moved above $82.85 completing a double bottom pattern.
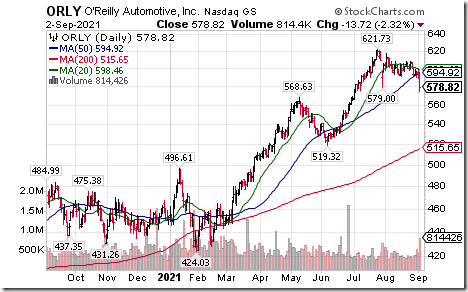
O’Reilly $ORLY a NASDAQ 100 stock moved below $579.00 completing a double top pattern.
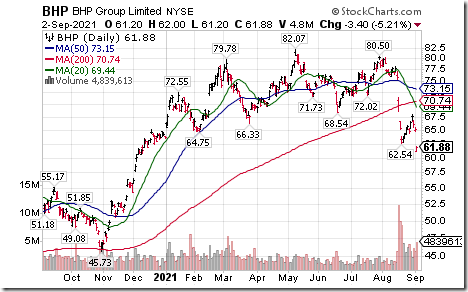
BHP $BHP moved below $62.54 extending an intermediate downtrend.
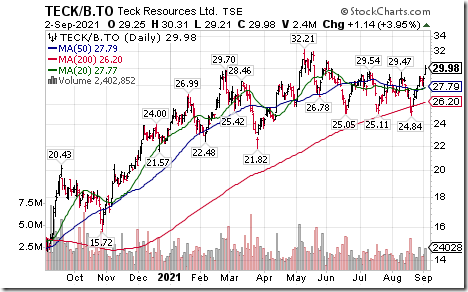
Teck Resources $TECK.B.CA a TSX 60 stock moved above $29.47 and $29.54 as well as US$23.57 and US$23.70 resetting an intermediate uptrend.
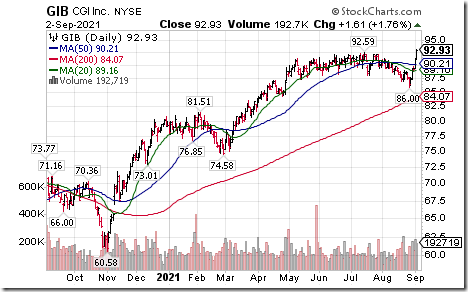
CGI Group $GIB a TSX 60 stock moved above US$92.59 to an all-time high extending an intermediate uptrend
Trader’s Corner
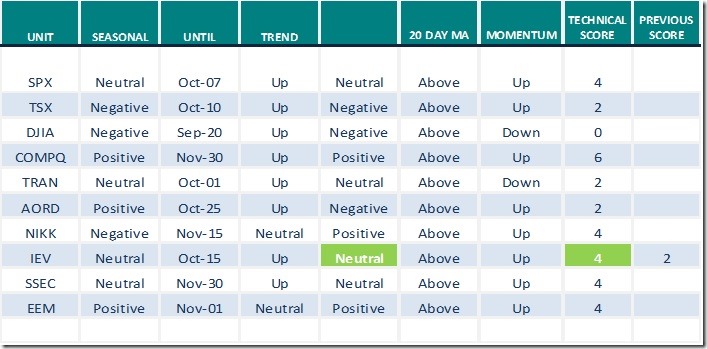
Equity Indices and Related ETFs
Daily Seasonal/Technical Equity Trends for September 2nd 2021
Green: Increase from previous day
Red: Decrease from previous day
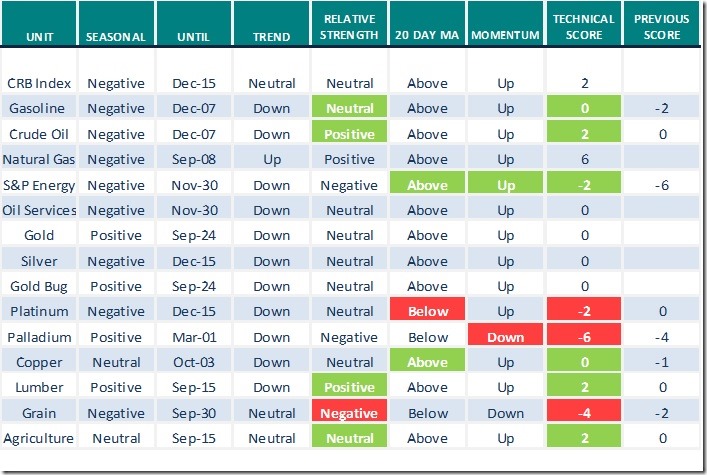
Commodities
Daily Seasonal/Technical Commodities Trends for September 2nd 2021
Green: Increase from previous day
Red: Decrease from previous day
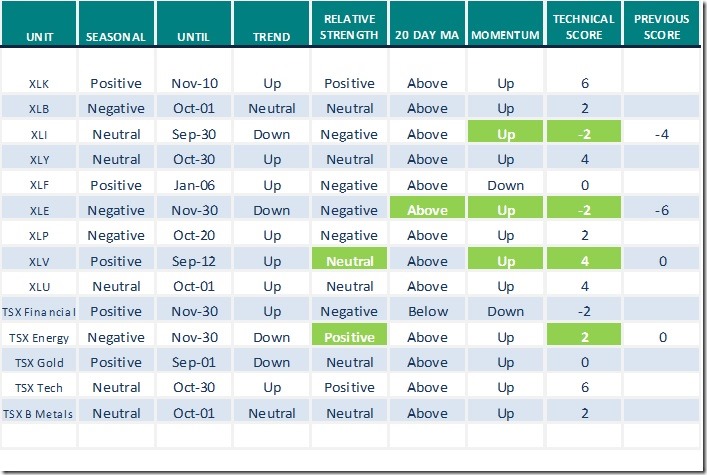
Sectors
Daily Seasonal/Technical Sector Trends for September 2nd 2021
Green: Increase from previous day
Red: Decrease from previous day
All seasonality ratings are based on performance relative to the S&P 500 Index
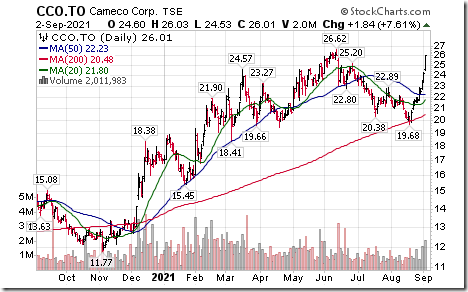
On the charts, the stock attracted exceptional buying interest during the past week and is now testing its 10 year high at Cdn$26.52. Shares are responding to higher spot uranium prices.
Another way to play is through the ETF: URA that is heavily weighted in Cameco.
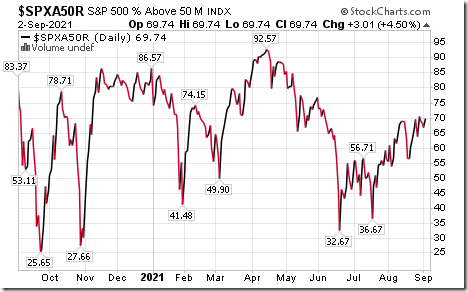
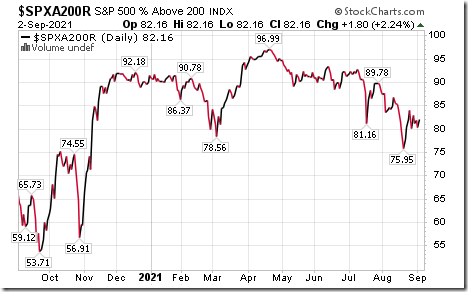
S&P 500 Momentum Barometers
The intermediate term Barometer added 4.01 to 69.74 yesterday. It remains Overbought.
The long term Barometer added 1.80 to 82.15 yesterday. It remains Extremely Overbought.
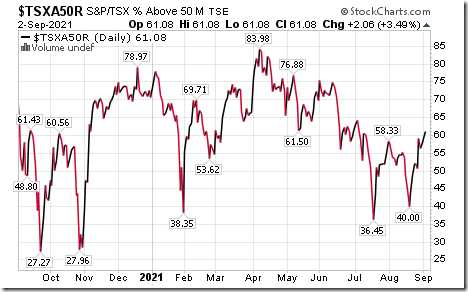
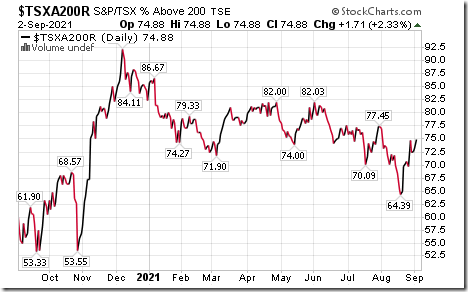
TSX Momentum Barometers
The intermediate term Barometer added 2.06 to 61.08 yesterday. It changed from Neutral to Overbought on a move above 60.00.
The long term Barometer added 1.71 to 74.88 yesterday.it remains Overbought.
Disclaimer: Seasonality and technical ratings offered in this report and at
www.equityclock.com are for information only. They should not be considered as advice to purchase or to sell mentioned securities. Data offered in this report is believed to be accurate, but is not guaranteed
This post was originally publised at Vialoux's Tech Talk.


