by Don Vialoux, EquityClock.com
Technical Notes for yesterday at
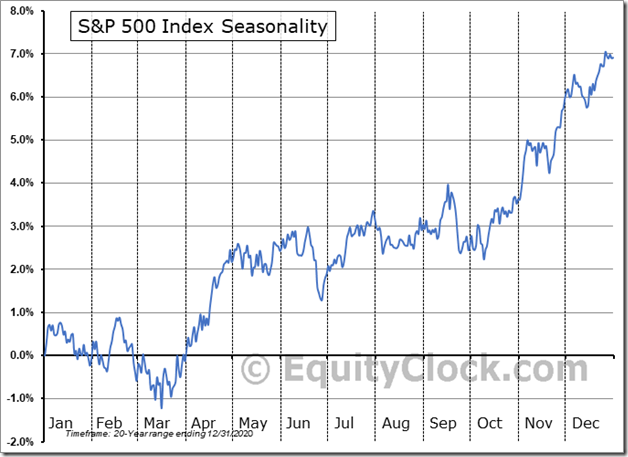
Over the past 20 years, the S&P 500 Index has averaged a loss of 0.8% in September with a large dispersion of results around the mean. equityclock.com/2021/08/31/… $SPX $SPY $ES_F $STUDY
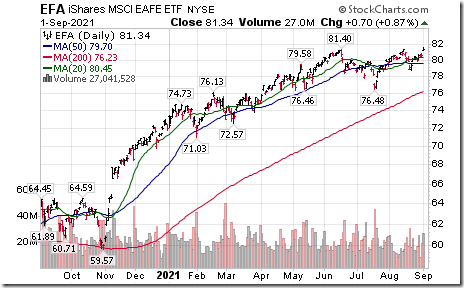
EAFE iShares $EFA moved above $81.40 to an all-time high extending an intermediate uptrend
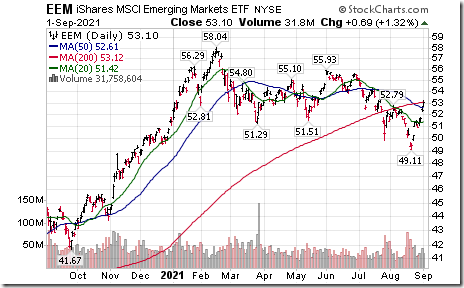
Emerging Markets iShares $EEM moved above intermediate resistance at $52.79.
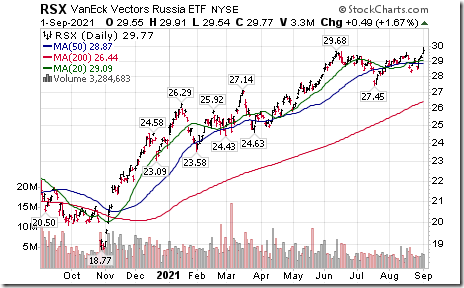
Russia ETF $RSX moved above $29.68 to an all-time high extending an intermediate uptrend.
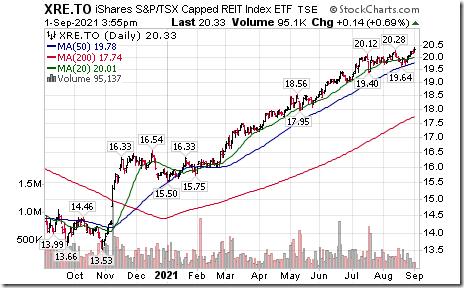
Canadian REIT iShares $XRE.CA moved above $20.25 to an all-time high extending an intermediate uptrend.
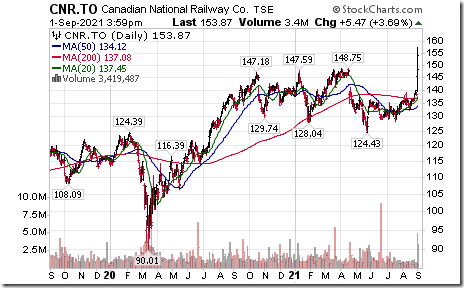
Canadian National Railway $CNR.CA a TSX 60 stock moved above $148.75 to an all-time high extending an intermediate uptrend.
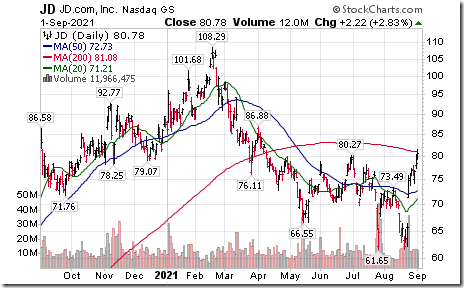
JD.com $JD a NASDAQ 100 stock moved above intermediate resistance at $80.27.
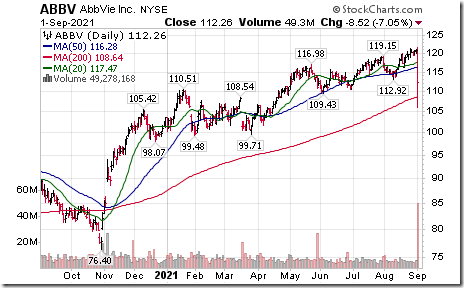
AbbVie $ABBV an S&P 100 stock moved below $112.92 and $109.43 setting an intermediate downtrend.
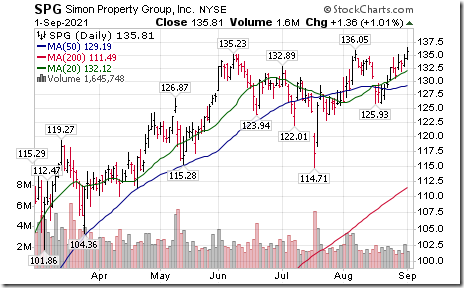
Simon Properties $SPG an S&P 100 stock moved above $136.05 extending an intermediate uptrend.
Trader’s Corner
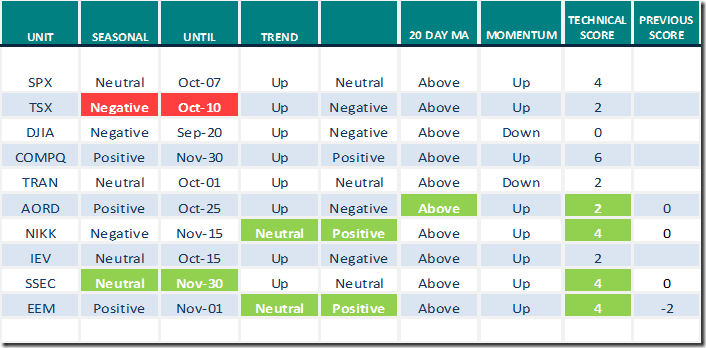
Equity Indices and Related ETFs
Daily Seasonal/Technical Equity Trends for September 1st 2021
Green: Increase from previous day
Red: Decrease from previous day
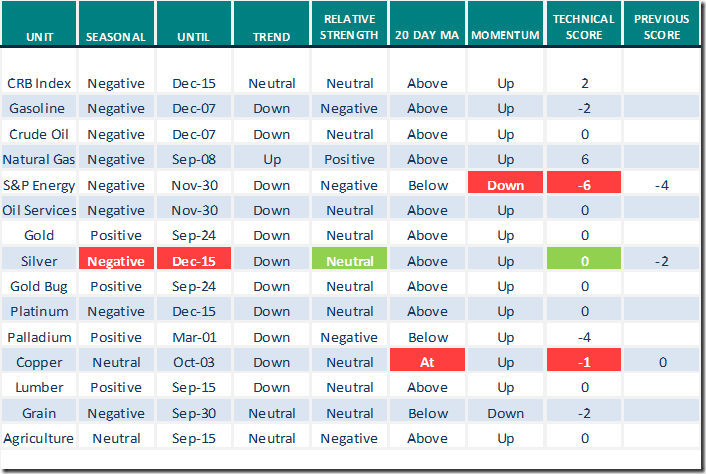
Commodities
Daily Seasonal/Technical Commodities Trends for September 1st 2021
Green: Increase from previous day
Red: Decrease from previous day
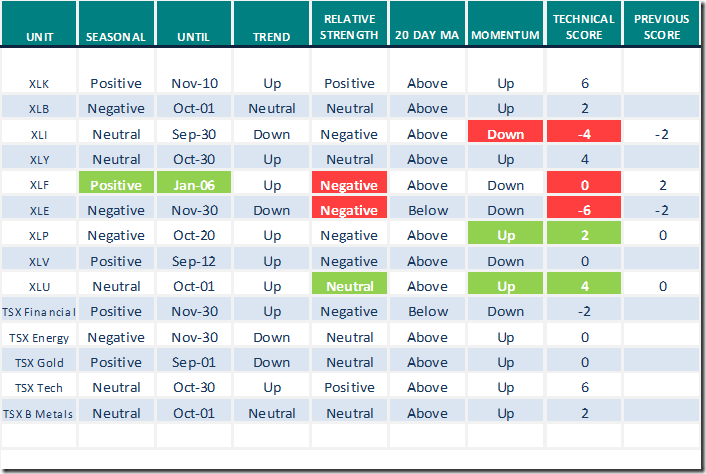
Sectors
Daily Seasonal/Technical Sector Trends for September 1st 2021
Green: Increase from previous day
Red: Decrease from previous day
All seasonality ratings are based on performance relative to the S&P 500 Index
Link to comments from www.uncommonsenseinvestor.com
Thank you to Mark Bunting and Uncommon SENSE Investor for links to the following reports.
Top Nine Favourite Stocks of Hedge Funds & Mutual Funds – Uncommon Sense Investor
https://uncommonsenseinvestor.com/this-book-is-somewhat-of-a-bible-to-me/
Why You Should Own Stocks Instead of Playing Musical Chairs – Uncommon Sense Investor
Market Buzz
Greg Schnell says “Feel the sizzle of softwear”. Following is a link:
https://www.youtube.com/watch?v=pIe3xlfxGo8
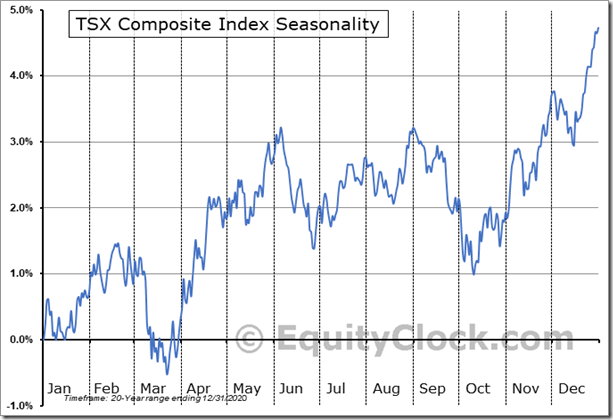
Seasonality Chart of the Day from www.equityclock.com
Seasonality of the TSX Composite Index changes from Neutral to Negative on a real and relative basis between now and October 10th
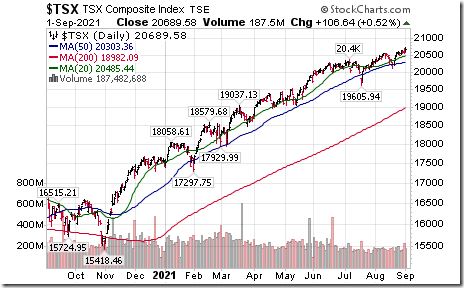
On the charts, the TSX Index closed at an all-time high yesterday. However, strength relative to other major world indices (notably broadly based European and U.S. indices has been negative since mid-June and its short term momentum indicators (e.g. daily Stochastics, RSI, MACD) are Overbought.
Observation
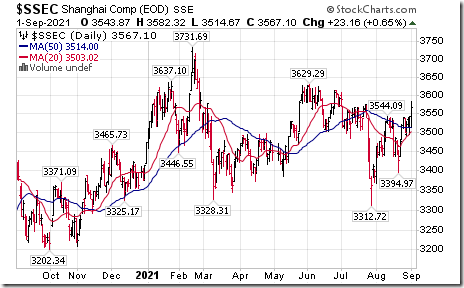
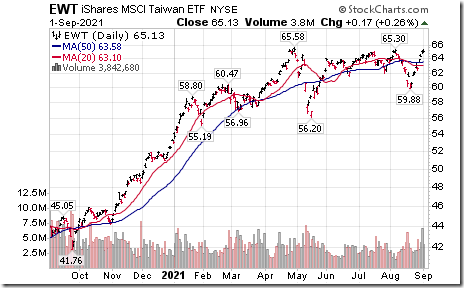
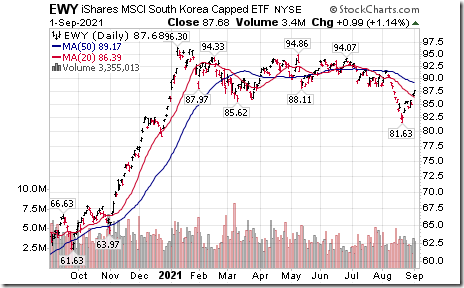
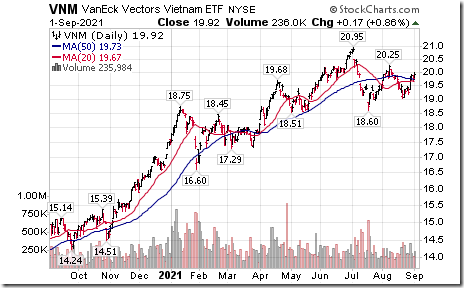
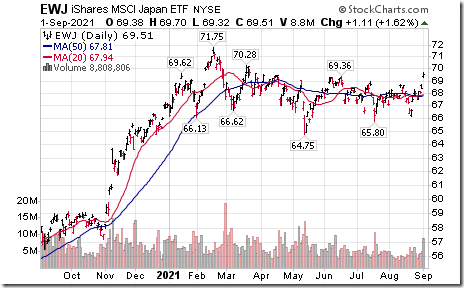
Far East equity markets and related ETFs recorded a significant upside momentum event yesterday. Most moved above their 20 and 50 day moving averages.
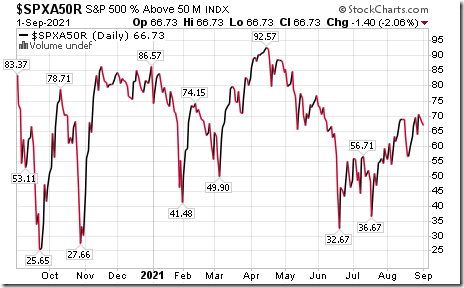
S&P 500 Momentum Barometers
The intermediate term Barometer slipped 1.40 to 66.73 yesterday. It remains Overbought.
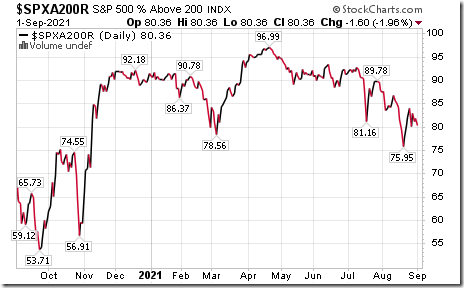
The long term Barometer eased 1.60 to 80.36 yesterday. It remains Extremely Overbought and showing early signs of extending a downtrend.
TSX Momentum Barometers
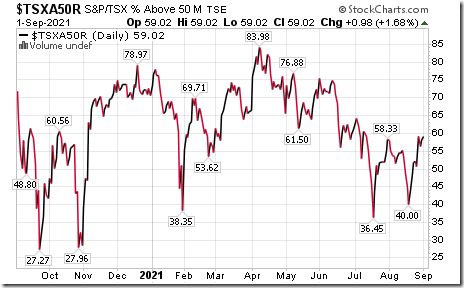
The intermediate term Barometer added 0.98 to 59.02 yesterday. It remains Neutral.
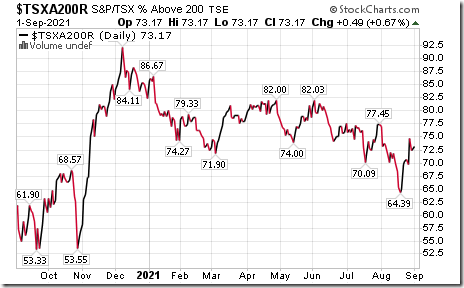
The long term Barometer added 0.49 to 73.17 yesterday. It remains Overbought.
Disclaimer: Seasonality and technical ratings offered in this report and at
www.equityclock.com are for information only. They should not be considered as advice to purchase or to sell mentioned securities. Data offered in this report is believed to be accurate, but is not guaranteed
This post was originally publised at Vialoux's Tech Talk.


