


by Rick Rieder, Global CIO, Blackrock
During a trying time for the world in 1939, Winston Churchill famously described the largest country in the world and soon-to-be second superpower, the Soviet Union, as “a riddle wrapped in a mystery inside an enigma.” Today, investors may feel similarly perplexed with regard to the valuations of the largest financial asset in the world, the U.S. Treasury market, as we continue to ride out a different challenging chapter in world history. On the one hand, factors like the spread of the Covid delta variant, and fresh mobility restrictions, have resulted in a strong bid for risk free assets. But on the other hand, economic activity continues to exceed most expectations, reaching post-World War 2 highs, as vaccination rates creep higher across most of the world amid a release of pent up consumer demand.
The Profound Challenge of Investing in Fixed Income Today
Against this backdrop, the Bloomberg-Barclays Treasury Index offers investors almost exactly the odds of a coin flip in terms of whether they are likely to post a gain or a loss in total return for the rest of 2021, an unusually risky return profile for a risk free asset (based on its historical volatility). The U.S. Aggregate Index (Agg) offers little better prospects: at a 40% probability of loss over the next year, and the chances of losing money on an investment in the Agg are higher than at any time in its pre-pandemic history. Once inflation is taken into account, the likelihood of the Treasury Index ,or Agg, posting a negative real return rises further still. That would be the case even if inflation were to moderate to a more normal 2% to 3% range, instead of the recent 5+% readings. Given the sizeable skew in the distribution of outcomes toward negative real returns, it has become extremely important to be selective in high quality fixed income, and to be truly vested in one’s investments so that portfolios are not permanently impaired.
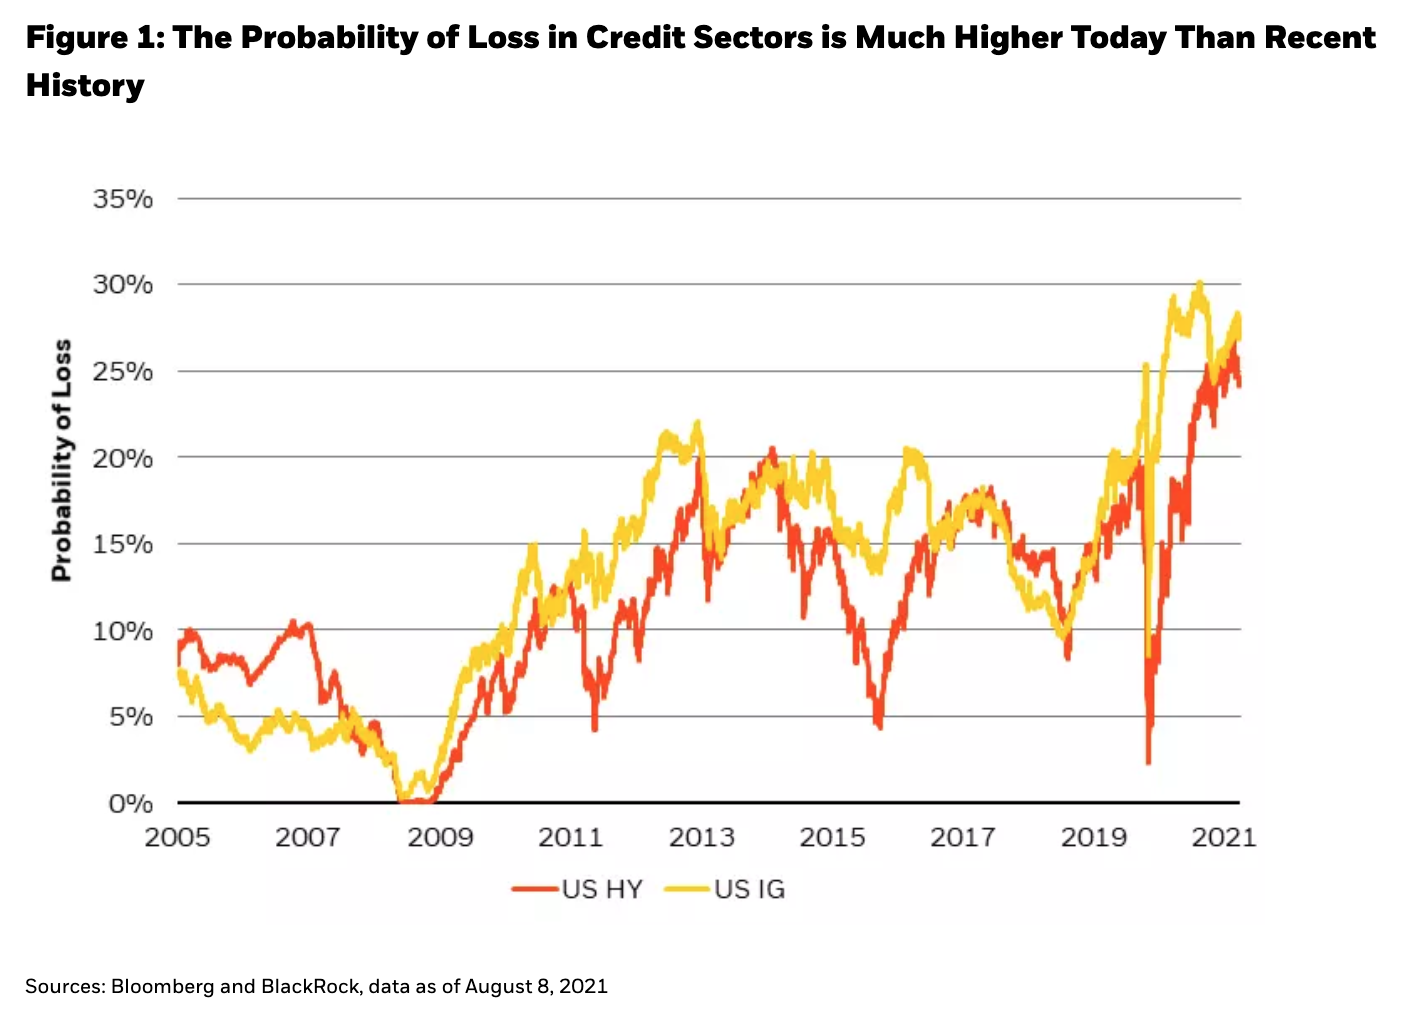
The world of spread assets displays a similar pattern. While one might argue that current spread levels are not unknown territory for corporate credit, the only other time in history that investment-grade and high yield index spreads were this tight was right before the Global Financial Crisis (GFC). And while spreads were able to maintain tight levels for many months back then, the probability of loss on corporate bonds was much lower, at less than 10% probability, because the coupons and all-in yields were double (or more) what they are today (see Figure 1).
In the short term, the common narrative around growth fears (or growth peaking) may not only explain the low level of Treasury yields, but continue to hold yields down until the market receives some clarity around the full potential impact of the delta variant and the efficacy of vaccinations against this and future Covid waves. There is certainly risk that the recovery, especially in travel and leisure, could be more turbulent than what was expected in the first half of the year. Nonetheless, U.S. real yields and real GDP growth have diverged to their widest point in at least 60 years, suggesting that growth fears are at least partially reflected in the price of safe assets.
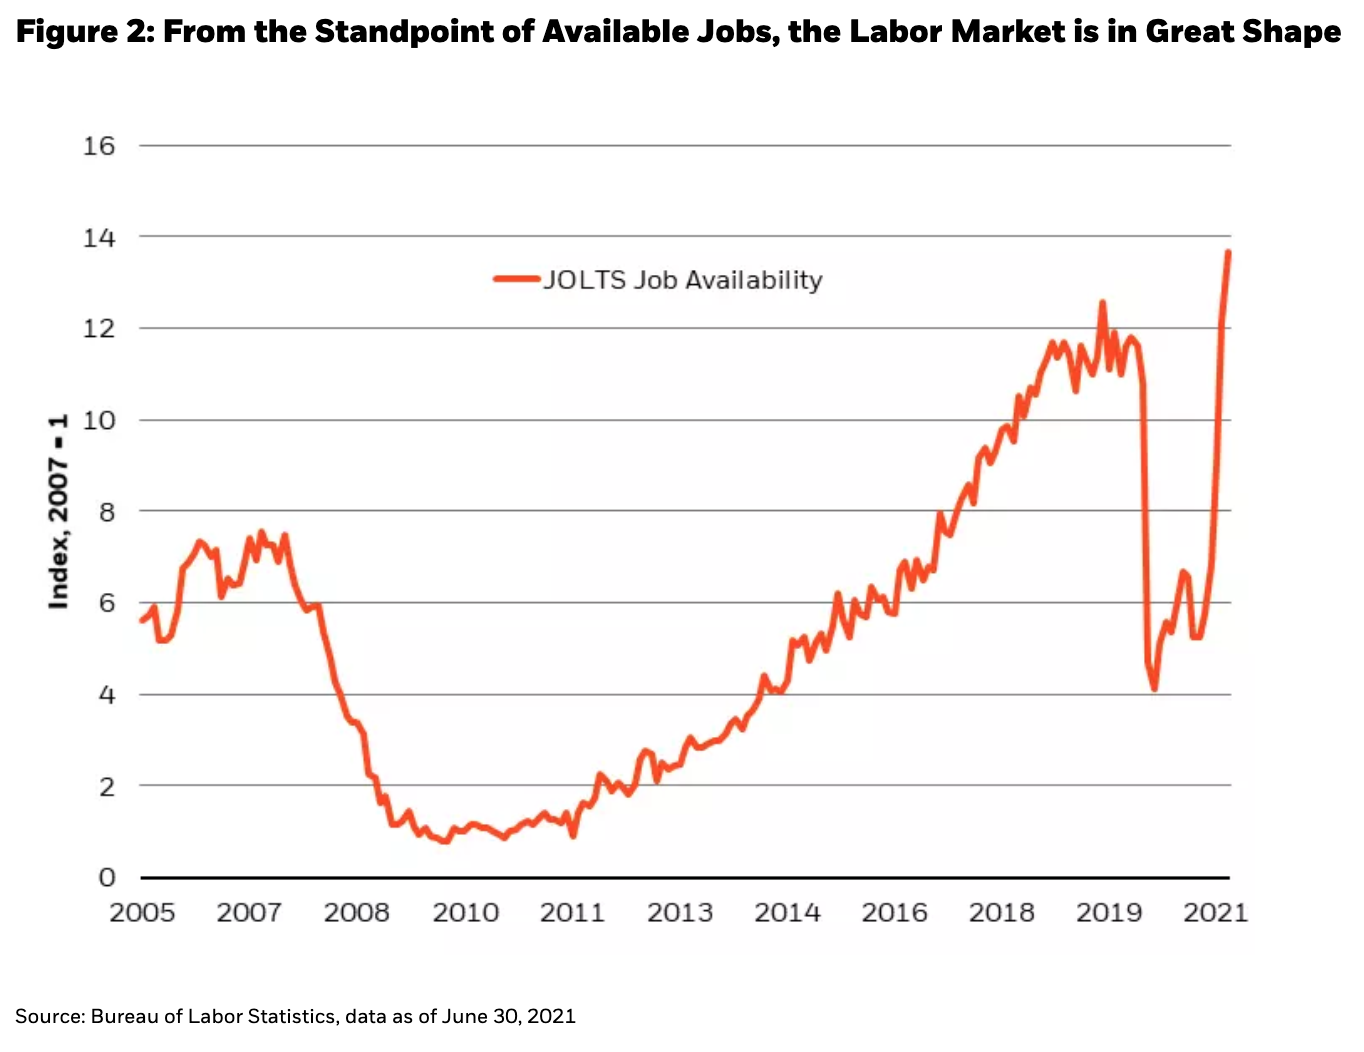
We think an equally important, albeit longer term story for investors to consider is that of the economic data, the consistency and strength of which have been somewhat staggering. Manufacturing, services new orders, capital expenditures, and consumption are all at multi-year highs. Corporate and household cash balances are at their highest level in history. And the labor market is in the best shape on record by way of job availability (see Figure 2). These metrics will probably moderate lower from multi-decade highs, especially if the pandemic recovery becomes a longer, and drawn out affair, but given the immense amount of policy support and liquidity in the system, it is unlikely that they would stray anywhere near what would be considered “unhealthy” territory (as seen in 2020).
While the delta variant and its impact on growth require monitoring, other reasons for the low level of Treasury yields seem less fundamentally driven. For instance, foreign demand has been exceptional, as Chinese bank deposits in dollars have grown at the fastest annual pace in years, in sympathy with strong exports out of China. Also, Japanese investors have the best opportunity since at least 2017 to invest in U.S. Treasuries and mortgages, after taking into account the cost of currency hedging. Additionally, pensions have reached the highest funding status since 2007, as a result of the rally in equity markets over the past year, which has prompted a reallocation into Treasuries and banks have added Treasuries at a ferocious pace, in line with deposit growth. The Treasury pumped $1 trillion of liquidity into the financial system over the last few months, including $300 billion in July, driving all asset prices higher; and a large short base, including participants from asset managers to central banks to corporate treasuries, was forced to unwind bets against the Treasury market, as those bets went sour in recent months. These latter factors (putting the delta variant aside) appear to be non-economic in nature, rather than value oriented.
Too Much Debt…or Too Much Demand?
Arguably, there is not enough federal debt to meet this demand, creating a scarcity of interest-bearing safe assets. Traditionally, the worry over excessive sovereign debt has always been that private borrowers get “crowded out” from securing scarce investment dollars. Today, there is a surplus of dollars and a lack of demand for bank credit. So, excessive liquidity in addition to a deficit of Treasury bonds is “crowding in” investors toward capital misallocation and financial market imbalances by forcing the non-economic buying of Treasuries and other high-quality fixed income assets. Instead of too much debt, the price action in the Treasury market suggests that there is too much demand.
Follow Rick Rieder on Twitter
While many prognosticators point to debt/GDP as the holy grail measure of sovereign debt sustainability, that is akin to looking at debt/revenue for a corporate entity, an interesting but rather useless metric for determining stability, or default probability. When we compare the debt serviceability metrics of the corporate sector against that of the U.S. as a whole, the national debt does not seem unsustainable (and on some metrics it is better than it has been for years). Side-by-side, using standard corporate debt serviceability metrics, the national debt does not look worrying (see Figure 3). That doesn’t mean debt should be issued wantonly, but simply that a healthy national balance sheet can be very forgiving should a monetary policy error result in distorted asset valuations. In other words, there is no impending “debt crisis,” and rather the risk is of too much “crowding in” into the Treasury market, making it a challenging environment to be a vested investor in said markets today.

To avoid distorted valuations and to create a sustainable balance between asset prices and the economic environment, theory suggests that the marginal risky borrowing rate should be about equal to the equilibrium growth rate of the economy. If the marginal risky borrowing rate is below the equilibrium growth rate of the economy, it incentivizes excessive borrowing, or borrowing to fund sub-par cash flows. Conversely, if the marginal risky borrowing rate is above the equilibrium growth rate of the economy, it creates a bust, as the economy cannot deliver the cash flows needed to service new loans. This “boom/bust cycle” can be seen in the rise and fall of BBB corporate yields, one measure of the marginal borrowing rate for the risky borrower, relative to equilibrium growth (see Figure 4).

This concept can also be thought of in reverse: one way to create conditions that support higher borrowing rates would be to boost growth in tandem. Boosting nominal growth is not always easy, as some traditional sources of demand like population growth are slowing. Inflation is another driver of nominal growth, but it can’t always be counted on, nor can its reaction to monetary policy stimuli always be predicted (for example, monetary policy often reacts to wage inflation, which used to drive overall inflation, but has become more of a drag on prices in recent decades).
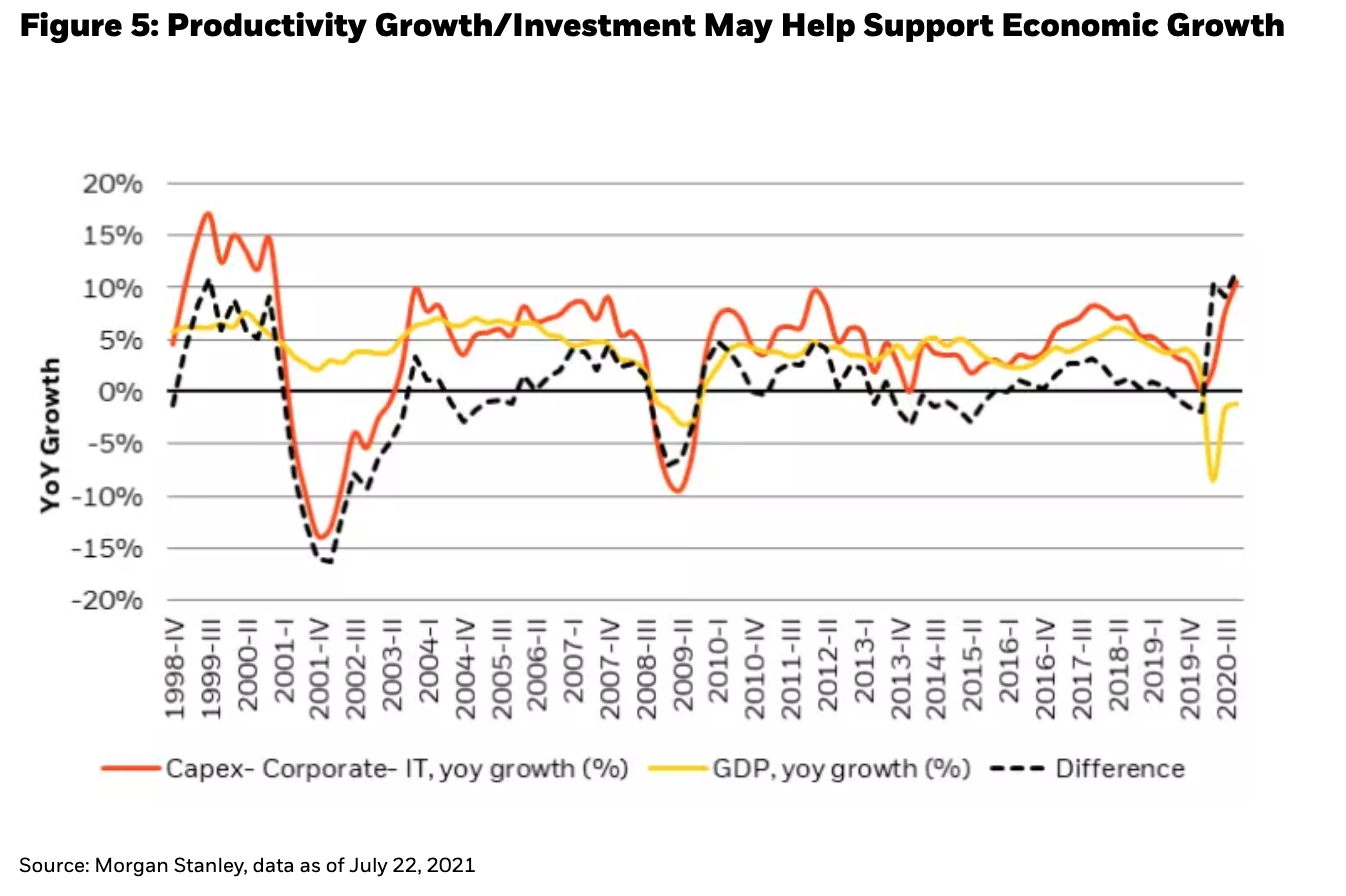
But one critical growth driver that can be engineered through sufficient investment is productivity. Not only does productivity lead to a general improvement in quality of life, it often helps bridge wealth gaps (by raising disposable income) and moderates long term inflation as well (the same quantity of goods or services can be procured at a lower cost through new innovative techniques). The corporate world is heavily investing in the productivity story today, with information technology (IT) spending growing as a share of revenue, especially in non-tech sectors, such that GDP growth is lagging IT capex growth by the largest margin since the internet buildout in the late 1990s. There is likely to be a significant improvement in broad economic growth as a result of productivity improvements in the years to come (see Figure 5).
So How do we Invest in a World of Disequilibrium?
Robust liquidity and a low rate paradigm risk creating financial economy exuberance. Crowding into financial assets can create bursts of volatility, and in this environment a stable portfolio with a positive real yield becomes one that we can truly feel vested in.
Until central banks have dialed back accommodation and restored pricing that is more in line with economic conditions, high quality fixed income remains a smaller part of our portfolios, although it will likely still act as a hedge should the Covid delta variant (or others) prove to be a material economic setback. While there is a growing pool of high-quality assets, the income being generated off that pool is shrinking! The income available to investment grade credit investors is lower than in 2009, or 2015, despite the market size having tripled and doubled since those years, respectively. The Treasury aggregate index has grown five times since 2007, yet it delivers fewer dollars of income today.
Still, there are segments of the market that offer reasonable yield. Preferred securities, loans, and corporate hybrids offer a substantial premium to longer duration corporates. And securitized assets continue to be a big portion of the investment opportunity set, in our view, and specifically those bonds that are further down the capital stack. While high quality and short duration credit aren’t that interesting from a price return perspective, the economic and policy environment should keep flows into the asset class strong, and defaults low, making the horizon rate of return in credit likely achievable as a total return target.
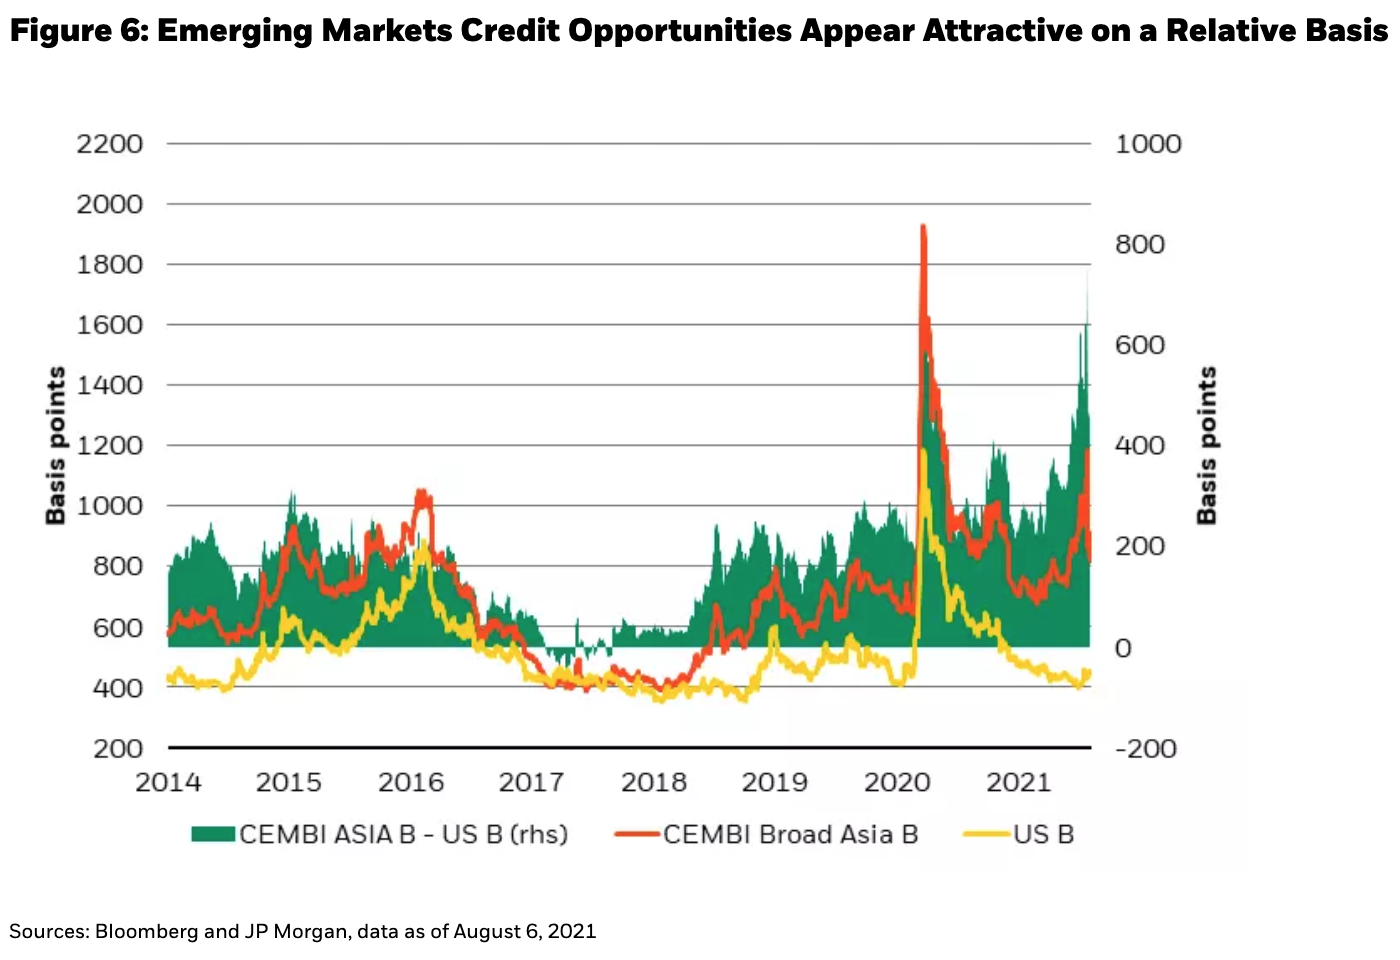
In the emerging markets (EM) world, high yield currencies have lagged typically correlated assets like commodities and offer yields that have some margin of safety. And emerging market credit has cheapened considerably as a result of the delta variant and regulatory concerns in China, such that it is quite attractive when compared to U.S. credit, particularly in Asia, though not without risk (see Figure 6). Scale and security selection are important when thinking about managing risk in low quality emerging market assets. With spreads that are triple those of similarly rated U.S. bonds, and a beta of a similar multiple, opportunistic portfolio exposure to EM high yield that is just a fraction of exposure to U.S. high yield could create a similar carry profile, with some price upside, while mitigating the potential downside through sizing. Such relative sizing could also allow a portfolio to build cash, which can act as a portfolio stabilizer (balanced against the riskier profile of EM HY) and a resource to capture future opportunities from market dislocations (to read more about our views on the role of cash in a portfolio, read our recent piece The Queen’s Gambit Declined).
But the biggest beneficiary of disproportionately low high-quality yields is the equity market. The S&P 500 forward earnings yield looks attractive relative to 10-year Treasury yield, or the BBB corporate yield. At the same time, the cheap borrowing cost incentivizes share buybacks, which in 2021 are estimated to return to near all-time highs (according to Goldman Sachs data, 2021 will be the second highest year on record for stock buybacks, at over $700 billion worth).
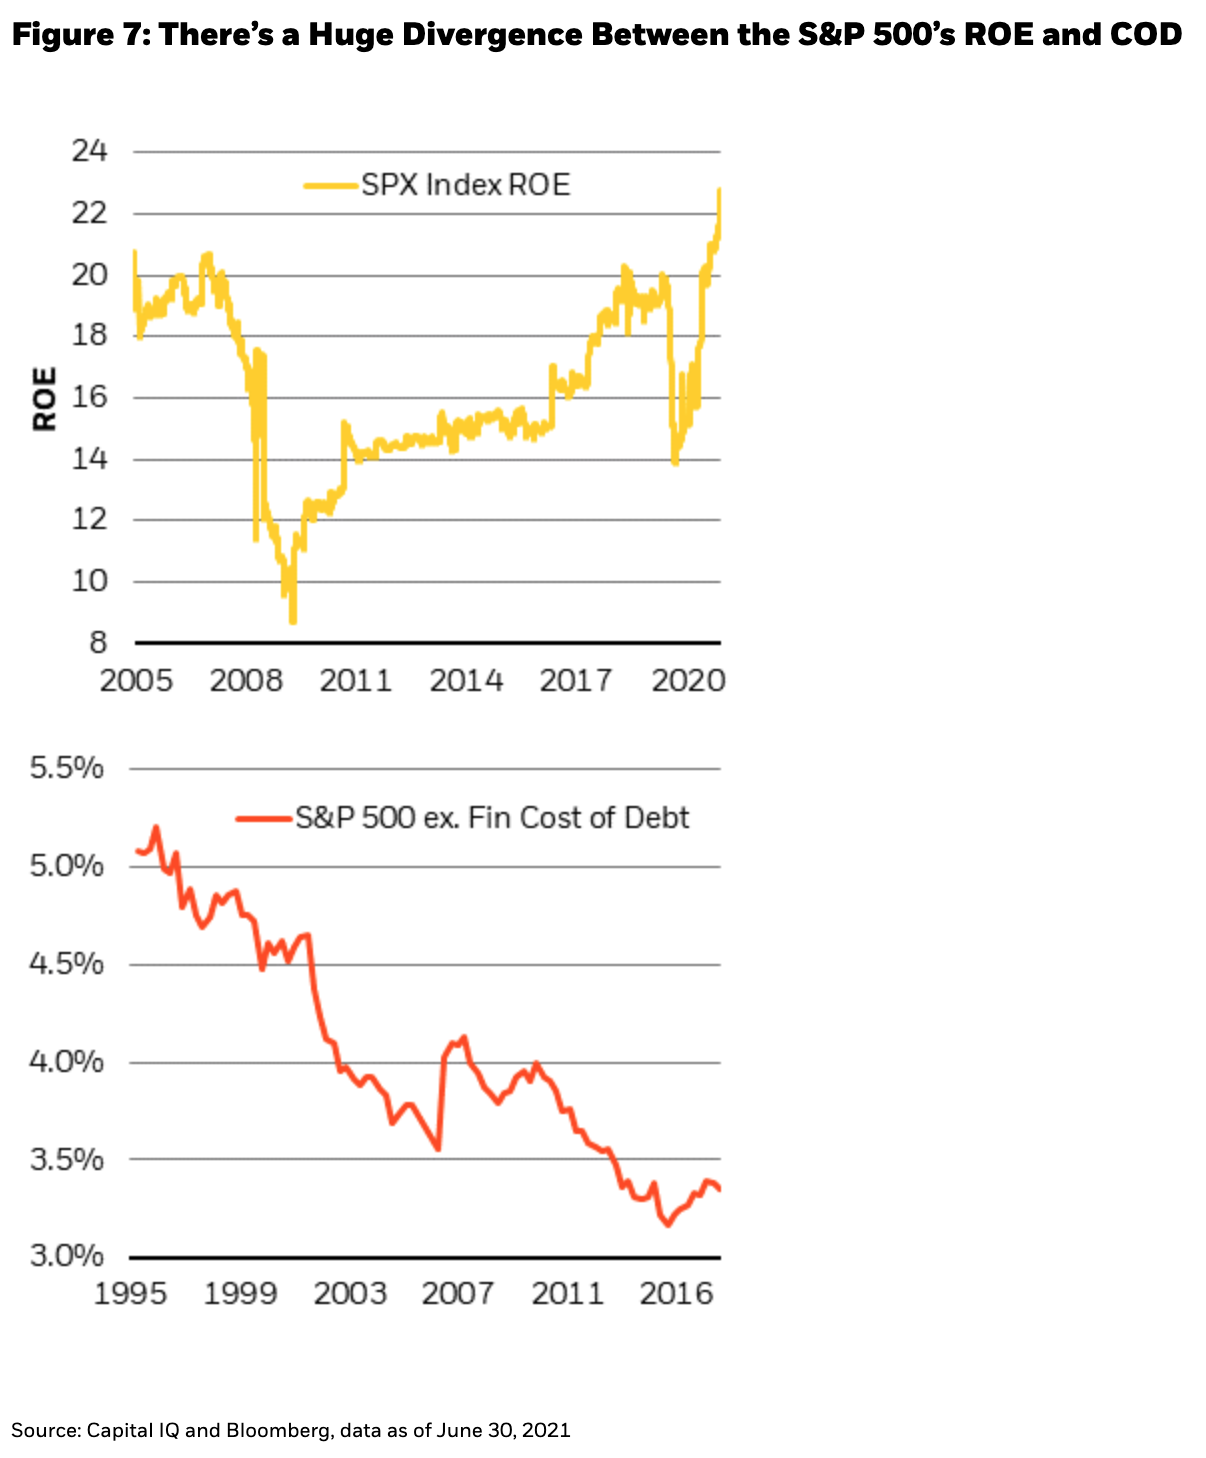
While some commentators have grown concerned by the level of equity indices, the operating environment for a broad swathe of companies has arguably never looked better. With S&P 500 revenue growth running at 15%, and free cash flow margins north of 8%, cash on hand is reaching epic proportions (according to Bloomberg and Capital IQ data as of June 30, 2021). And according to the latest consensus estimates from Bloomberg (as of August 10, 2021), the S&P 500’s return on equity (ROE) in 2021 is 22.6% - compared to a cost of debt (COD) of about 3%. Such a huge divergence means that the concept of “leverage” for some companies simply becomes a mathematical construct to create an efficient cost of capital, rather than debt that is issued to actually finance a project, and hence offers little value to investors on the other side of the trade (those buying the debt). This huge spread between ROE and COD, and a large cash balance, creates both the incentive and ability for companies to return cash to shareholders, if for no other reason than to optimize their cost of capital (see Figure 7).
This concept of return on capital should directly influence how we can be more “vested in our investing,” just as the cost of capital influences the way companies use the resources available to them in making their own capital allocation decisions. While the equity of companies on the right side of “megatrends” (such as cloud computing, e-commerce, the internet of things, and 5G) have been the greatest beneficiaries of the high-growth, low-rate, post-pandemic environment, the list of companies and sectors with attractive growth prospects is getting longer and more diverse. Return potential at the top of the capital stack may seem scarce, but opportunities abound further down the capital stack (including parts of lower quality fixed income). Thus, it’s a ripe environment for security selection and active management.
While Churchill probably never solved the enigma that was the Soviet Union, investors who are able to build a portfolio that they can truly be vested in will likely be able to ride out the perplexity of this unique environment between interest rates and growth rates, and once equilibrium is restored, they may find that they emerge with superior risk-adjusted returns.
 Russell BrownbackManaging Director, is Head of Global Macro positioning for Fixed Income.
 Trevor SlavenManaging Director, is a portfolio manager on BlackRock’s Global Fixed Income team and is also the Head of Macro Research for Fundamental Fixed Income.
 Navin SaigalDirector, is a portfolio manager and research analyst in the Office of the CIO of Global Fixed Income, and he serves as Chief Macro Content Officer.


