by Don Vialoux, EquityClock.com
The Bottom Line
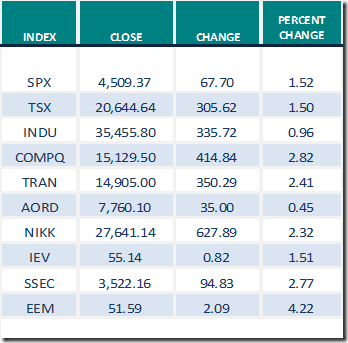
Developed world equity indices were higher last week. Greatest influences remain ramping up of a fourth wave by COVID 19 (negative) and continued expansion of distribution of a COVID 19 vaccine (positive).
Observations
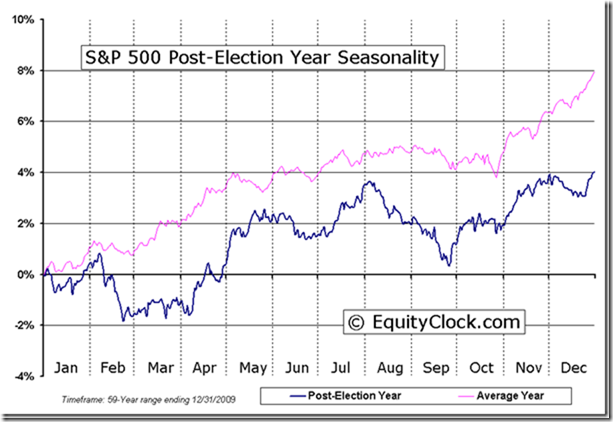
Unfavourable seasonal influences for equity indices from the beginning of August to the beginning of October (particularly in a Post-U.S. Presidential Election year) have yet to appear. North American equity indices including the S&P 500 Index, NASDAQ Composite Index and TSX Composite Index reached all-time highs on Friday thanks partially to encouraging comments by Federal Reserve Chairman Jerome Powell that implied continuation of an “easy money” monetary policy until at least late this year. The Dow Jones Industrial Average also is testing its all-time high at 35,631.19. Other key U.S. equity indices including the Dow Jones Transportation Average and the Russell 2000 Index moved higher last week, but are not close to their all-time highs. North American equity indices have a history of recording a mild correction of 3%-4% between now and the beginning of October followed by resumption of an intermediate uptrend to the end of the year. Note the link to a report by Larry Williams later in this report predicting an important low by U.S. equity indices in October.
Short term short term indicators for U.S. equity indices and sectors (20 day moving averages, short term momentum indicators) moved higherlast week.
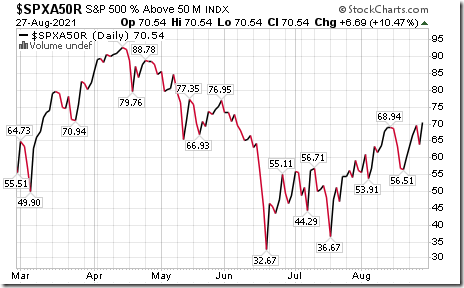
Intermediate term technical indicator for U.S. equity markets (Percent of S&P 500 stocks trading above their 50 day moving average) moved higher last week. It remained Overbought.. See Barometer charts at the end of this report.
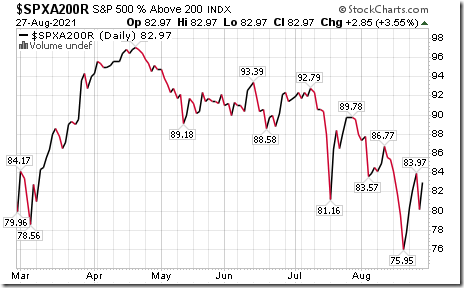
Long term technical indicator for U.S. equity markets (Percent of S&P 500 stocks trading above their 200 day moving average) moved higher last week. It changed from Overbought to Extremely Overbought on a move below 80.00. See Barometer chart at the end of this report.
Short term momentum indicators for Canadian indices and sectors moved higher last week.
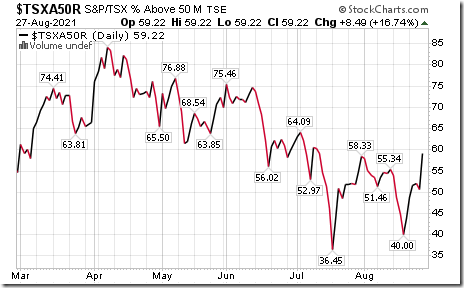
Intermediate term technical indicator for Canadian equity markets moved higher last week. It remained Neutral. See Barometer chart at the end of this report.
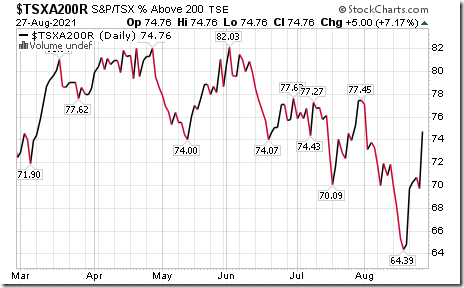
Long term technical indicator for Canadian equity markets (Percent of TSX stocks trading above their 200 day moving average) moved higher last week. It remained Overbought. See Barometer charts at the end of this report.
Economic News This Week
Annualized Canadian Second Quarter GDP to be released at 8:30 AM EDT on Tuesday is expected to grow at a 6.7% rate versus growth at a 5.6% rate in the first quarter.
August Chicago Purchasing Managers Index to be released at 9:45 AM EDT on Tuesday is expected to drop to 69.8 from 73.4 in July.
August ADP Non-farm Employment to be released at 8:15 AM ETD on Wednesday is expected is expected to increase to 500,000 from 330,000 in July.
August ISM Manufacturing PMI to be released at 10:00 AM EDT on Wednesday is expected to slip to 58.6 from 59.5 in July.
August Non-farm Productivity to be released at 8:30 AM EDT on Thursday is expected to increase 2.4% versus a gain of 2.3% in July.
July U.S. Trade Deficit to be released at 8:30 AM EDT on Thursday is expected to ease to $75.10 billion from $75.70 billion in June.
Canadian July Merchandise Trade Balance to be released at 8:30 AM EDT on Thursday is expected to be a deficit of $0.68 billion versus a surplus of $3.23 billion in June.
August Non-farm Payrolls to be released at 8:30 AM EDT on Friday are expected to reach 665,000 versus 943,000 in in July. August Unemployment Rate is expected to slip to 5.2% from 5.4% in July. August Hourly Earnings are expected to increase 0.4% versus a gain of 0.4% in July.
August Non-Manufacturing ISM to be released at 10:00 AM EDT on Friday is expected to slip to 61.3 from 64.1 in July.
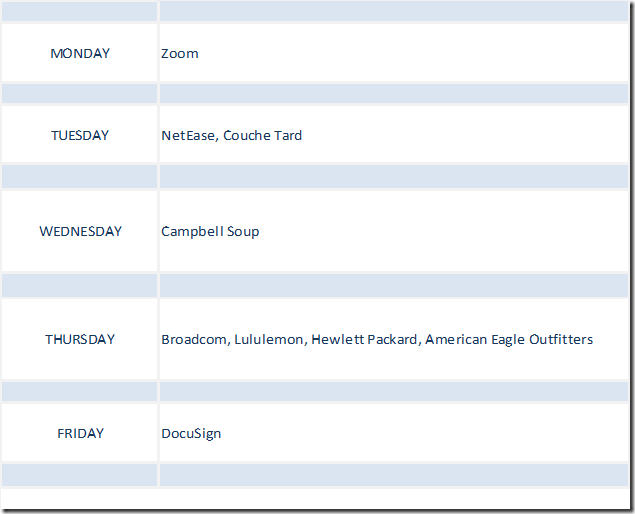
Earnings News Released This Week
Trader’s Corner
Equity Indices and Related ETFs
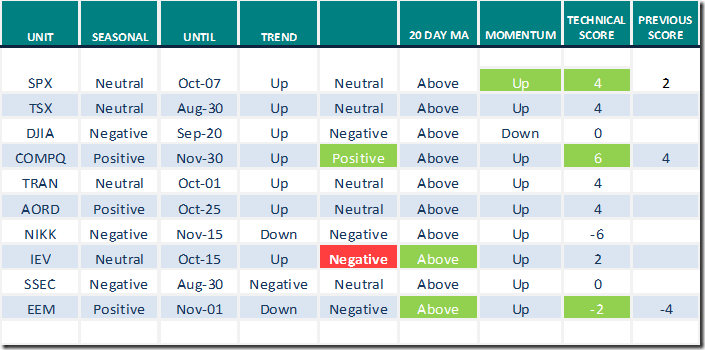
Daily Seasonal/Technical Equity Trends for August 27th 2021
Green: Increase from previous day
Red: Decrease from previous day
Commodities
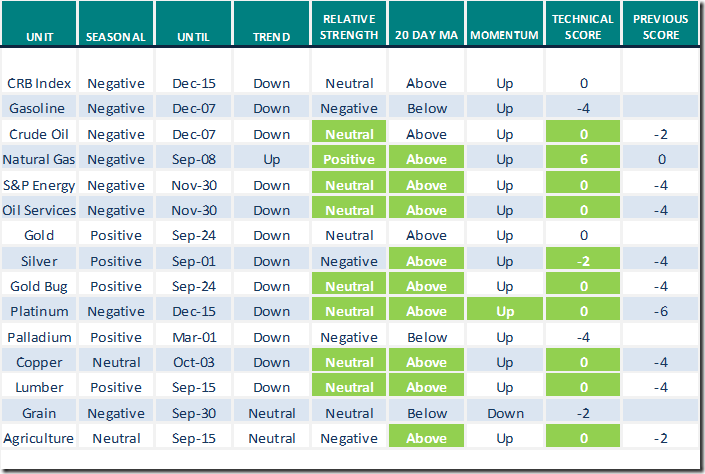
Daily Seasonal/Technical Commodities Trends for August 27th 2021
Green: Increase from previous day
Red: Decrease from previous day
Sectors
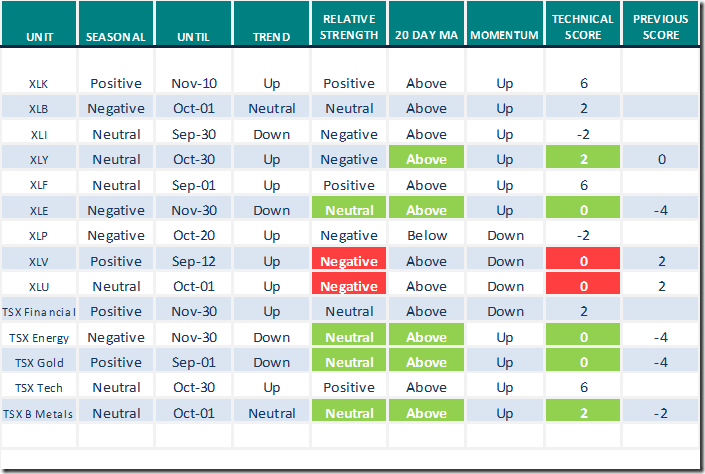
Daily Seasonal/Technical Sector Trends for August 27th 2021
Green: Increase from previous day
Red: Decrease from previous day
All seasonality ratings are based on performance relative to the S&P 500 Index
Interesting timely links from valued providers
Lots of links this week
Great Buying Point Coming for Stocks?
Larry Williams says “Prepare for the next seasonal buy opportunity in late October. See:
https://www.youtube.com/watch?v=d9nUOo2QayM
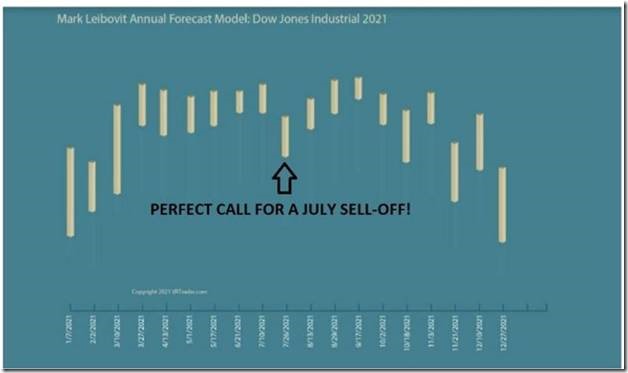
On the other hand, Mark Leibovit’s annual forecast for the Dow Jones Industrial Average suggests possibility of an intermediate peak this week followed by weakness to the end of the year. The forecast has been remarkably accurate so far this year.
Links to comments from www.uncommonsenseinvestor.com
Thank you to Mark Bunting and Uncommon SENSE Investor for links to the following reports:
Record Revenues & Earnings Mean Opera For Stocks Ain’t Over Yet – Uncommon Sense Investor
Top Idea Brown & Brown Higher by 30%+ Since Recommendation – Uncommon Sense Investor
Technical Scoop
Thank you to David Chapman and www.EnrichedInvesting.com for a link to their weekly comment
Michael Campbell’s Money Talks
Thank you to Michael Campbell for a link to his weekly Money Talk’s podcast
1st Online and Podcast-only Show Is Now Available! (mikesmoneytalks.ca)
Technical Scores
Calculated as follows:
Intermediate Uptrend based on at least 20 trading days: Score 2
(Higher highs and higher lows)
Intermediate Neutral trend: Score 0
(Not up or down)
Intermediate Downtrend: Score -2
(Lower highs and lower lows)
Outperformance relative to the S&P 500 Index: Score: 2
Neutral Performance relative to the S&P 500 Index: 0
Underperformance relative to the S&P 500 Index: Score –2
Above 20 day moving average: Score 1
At 20 day moving average: Score: 0
Below 20 day moving average: –1
Up trending momentum indicators (Daily Stochastics, RSI and MACD): 1
Mixed momentum indicators: 0
Down trending momentum indicators: –1
Technical scores range from -6 to +6. Technical buy signals based on the above guidelines start when a security advances to at least 0.0, but preferably 2.0 or higher. Technical sell/short signals start when a security descends to 0, but preferably -2.0 or lower.
Long positions require maintaining a technical score of -2.0 or higher. Conversely, a short position requires maintaining a technical score of +2.0 or lower
Changes Last Week
Seasonality Chart of the Day from www.EquityClock.com
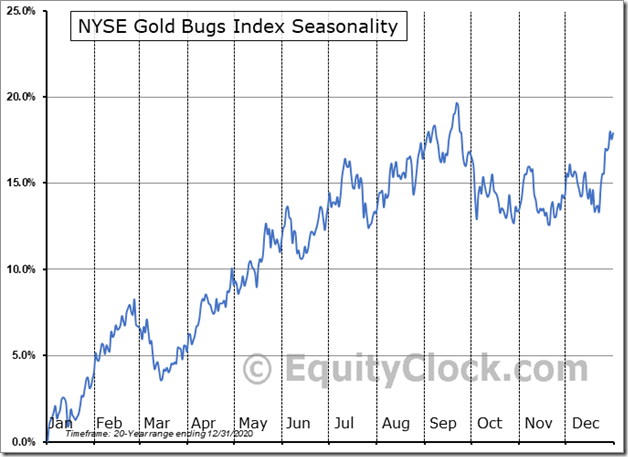
Seasonal influences for gold and related investments are positive to September 20th.
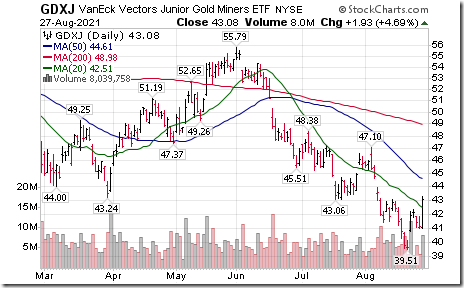
Better late than never! Gold, gold equities and related investments finally came alive on Friday following Jerome Powell’s comments. Traders are predicting that the U.S. Federal Reserve will allow inflationary pressures to rise faster and farther until at least late this year. GDXJ already has bounced 9.0% from its recent low and moved above its 20 day moving average on Friday.
Technical Notes on Friday at
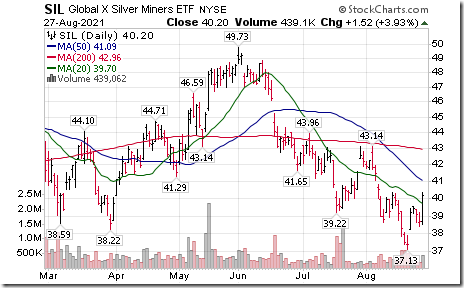
Strongest responses to Jerome Powell’s Jackson Hole Symposium speech are in the U.S. Dollar Index (weaker) and precious metal bullion/equity prices (stronger). Silver equity ETF $SIL is up over 4%. ‘Tis the season for strength in the precious metals equity sector until at least late September!
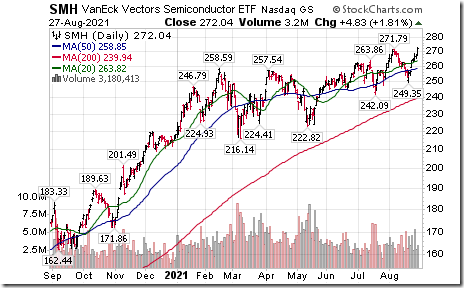
Semiconductor ETF $SMH moved above $271.79 to an all-time high extending an intermediate uptrend.
Editor’s Note: Seasonality currently is neutral until late September when it turns positive. If a subscriber to www.equityclock.com , click on seasonality charts at:
https://charts.equityclock.com/seasonal_charts/SMH_RelativeToSPX.png
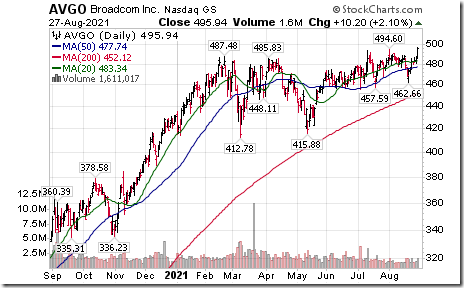
Broadcom $AVGO a NASDAQ 100 stock moved above $494.60 to an all-time high extending an intermediate uptrend.
Editor’s Note: Seasonal influences are favourable starting in mid-August. If a subscriber to www.EquityClock.com, click on seasonality charts at https://charts.equityclock.com/broadcom-corporation-nasdaqbrcm-seasonal-chart
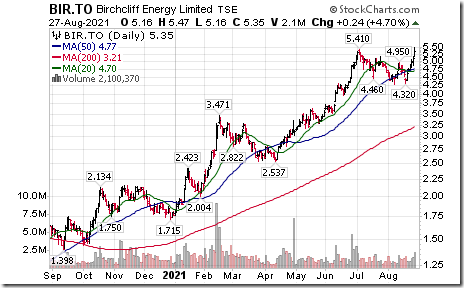
Birchcliff $BIR.CA a Canadian "gassy" stock moved above $5.41 extending an intermediate uptrend.
S&P 500 Momentum Barometers
The intermediate term Barometer added 6.69 on Friday and 10.42 last week to 70.54. It remains Overbought.
The long term Barometer added 2.85 on Friday and 5.21 last week to 82.97. It changed from Overbought to Extremely Overbought on a move above 80.00.
TSX Momentum Barometers
The intermediate term Barometer added 8.49 on Friday and 15.32 last week to 59.22. It remains Neutral.
The long term Barometer advanced 5.00 on Friday and 9.88 last week to 74.76. It remains Overbought.
Disclaimer: Seasonality and technical ratings offered in this report and at
www.equityclock.com are for information only. They should not be considered as advice to purchase or to sell mentioned securities. Data offered in this report is believed to be accurate, but is not guaranteed
This post was originally publised at Vialoux's Tech Talk.


