by Don Vialoux, EquityClock.com
Technical Notes released yesterday at
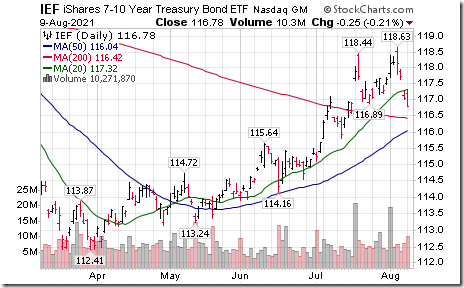
7-10 year Treasuries iShares $IEF moved below intermediate support at $116.89 setting a possible double top pattern.
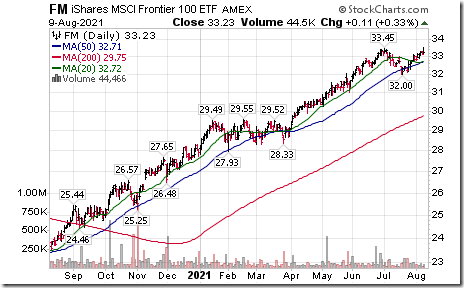
Frontier iShares $FM moved above $33.45 to an all-time high extending an intermediate uptrend.
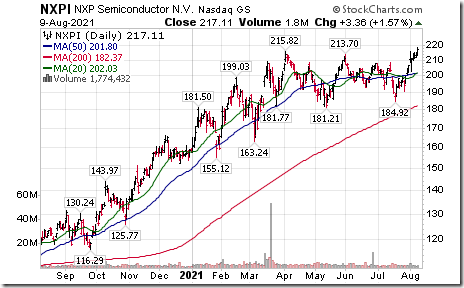
NXP Semiconductors $NXPI a NASDAQ 100 stock moved above $215.82 to an all-time high extending an intermediate uptrend.
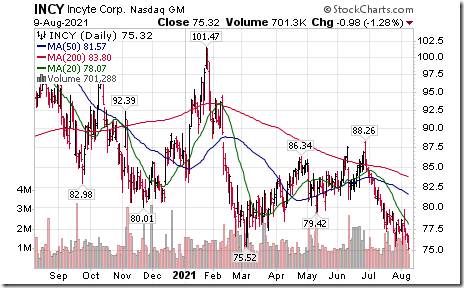
Incyte $INCY a NASDAQ 100 stock moved below $75.52 extending an intermediate downtrend.
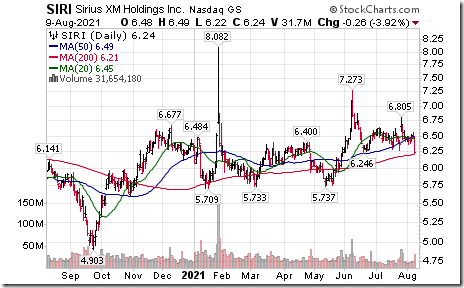
Serius XM $SIRI a NASDAQ 100 stock moved below $6.25 setting an intermediate downtrend.
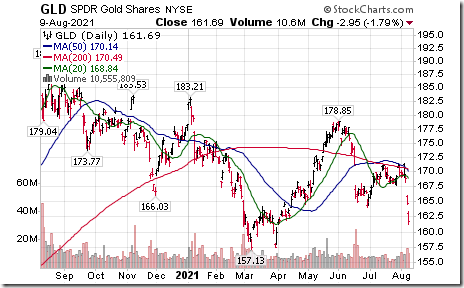
Gold ETN $GLD moved below $164.01 resuming an intermediate downtrend.
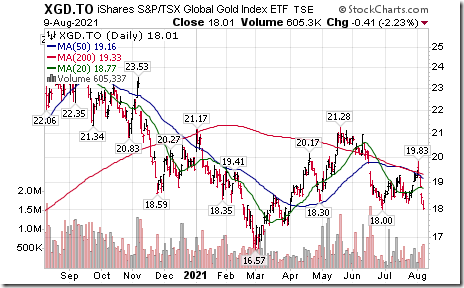
TSX Gold iShares $XGD.CA moved below $18.00 extending an intermediate downtrend
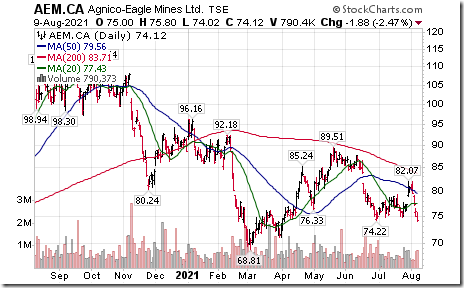
Several Canadian gold producer stocks moved below intermediate support with lower gold prices including Agnico-Eagle $AEM.CA and First Majestic $FR.CA
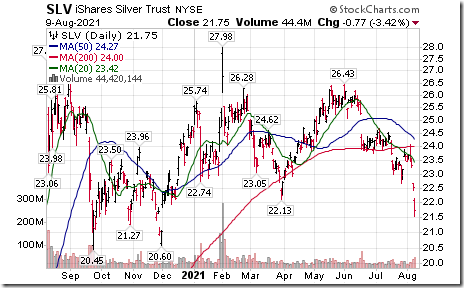
Silver ETN $SLV moved below $22.13 resuming an intermediate downtrend.
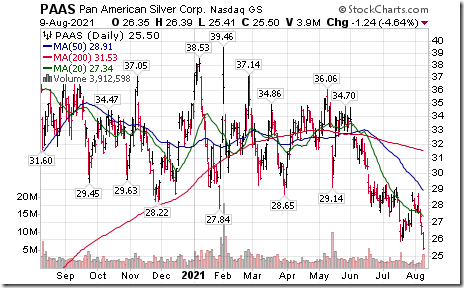
Pan American Silver $PAAS moved below $25.86 extending an intermediate downtrend. Responding to lower silver prices.
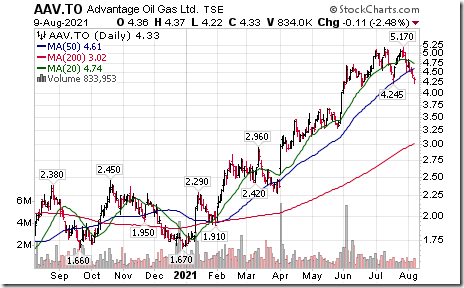
Advantage Oil and Gas $AAV.CA moved below Cdn$4.24 completing a double top pattern.
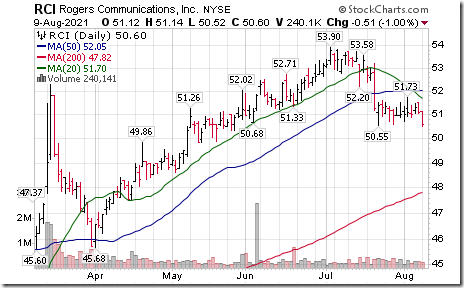
Rogers Communications $RCI a TSX 60 stock moved below US$50.55 completing a double top pattern.
Trader’s Corner
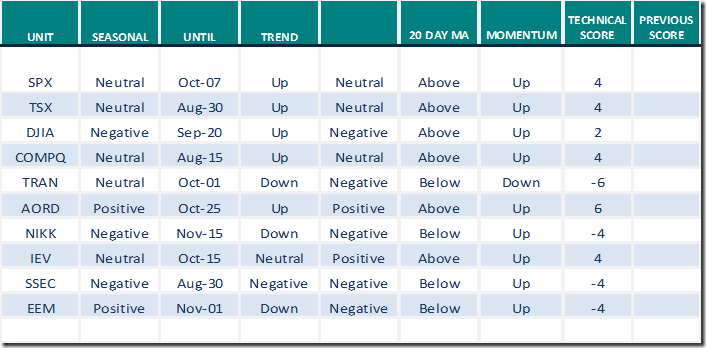
Equity Indices and Related ETFs
Daily Seasonal/Technical Equity Trends for August 9th 2021
Green: Increase from previous day
Red: Decrease from previous day
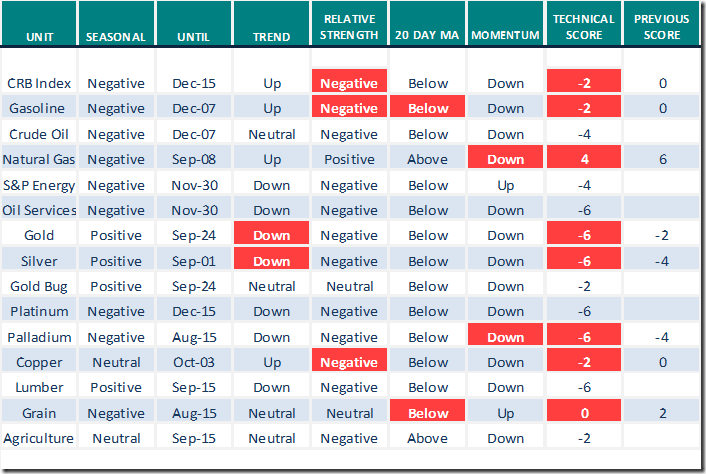
Commodities
Daily Seasonal/Technical Commodities Trends for August 9th 2021
Green: Increase from previous day
Red: Decrease from previous day
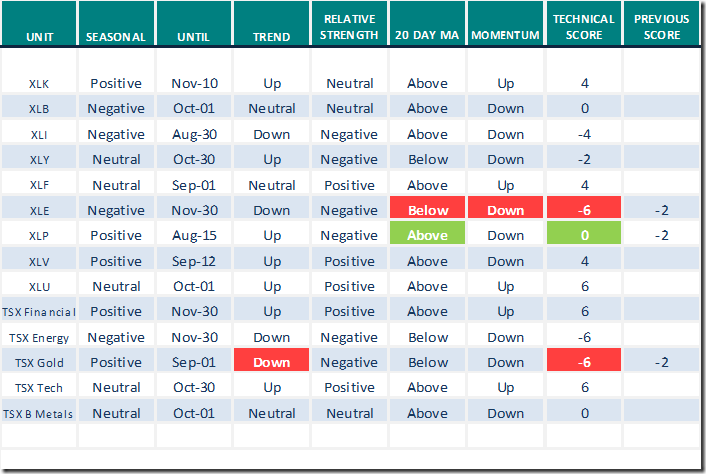
Sectors
Daily Seasonal/Technical Sector Trends for August 9th 2021
Green: Increase from previous day
Red: Decrease from previous day
All seasonality ratings are based on performance relative to the S&P 500 Index
Talking Points
The following talking points were developed before offering an interview on Wolf on Bay Street on Radio 640 at 7:00 PM EDT on Saturday:
North American equity markets are following their historic trend during a Post U.S. Presidential Election Year
- Strength to the first week in August during a “honey moon” period for the President in anticipation of a new political agenda, followed by:
- A brief period of weakness averaging a decline of 3% per period to early October, followed by
- Resumption of strength that tests all-time highs by the end of the year.
What about this year?
- All-time highs were reached early last week by the TSX Composite Index, S&P 500 Index, NASDAQ Composite Index and Dow Jones Industrial Average.
- Second quarter earnings reports released by major U.S. and Canadian companies during the past two weeks have been spectacular: 88% of reporting S&P 500 companies exceeded consensus revenue and earnings estimates. Earnings by reporting S&P 500 companies increased more than 74% on a year-over-year basis.
- Investor response to spectacular reports in most cases was “sell on news”. In most cases (but not all), traders took profits.
- Rising Delta COVID 19 infections in the Far East, Europe and the U.S. are starting to have an impact on equity markets. Weakness in Chinese and Japanese equity markets during the past three weeks has been significant
- Prospects for North American equity markets become more favourable after the beginning of October thanks to likely passage by the U.S. Congress of a bi-partisan infrastructure bill valued at $1.2 trillion. Caveat: If Congress passes a more aggressive $3 trillion bill, prospects could be truncated due to a likely spike in inflation pressures.
Other issues
- Volatility in U.S. and Canadian equity markets historically move higher from mid-July to mid-October when market volumes are less than average. Institutional investors go on holidays and give individual investors more influence on equity prices.
- Volatility in U.S. and Canadian equity markets are following their historic pattern this year. Volatility in the U.S. equity market measured by the VIX Index increased from 14% at the beginning of July to about 18% this week.
What to do
- Longer term investors can relax during the next 2-3 months. Go on holidays. Try to ignore the higher than average volatility in equity markets.
- Traders can take profits in anticipation of a shallow correction into early October. Look for special situations that historically have offered upside potential during the August to October period. Watch the charts for possible general re-entry points into October.
Canada’s bank sector has the characteristics of a special situation:
- Seasonal influences are positive between now the end of November
- Fiscal third quarter results to be reported late August/early September are expected to show above average (say 13%) year-over-year gains
- Limits set by the Bank of Canada on Canada’s major banks to increase their dividends and to announce share buybacks during the COVID 19 pandemic possibly could be lifted this fall.
- Technically, the sector has a positive profile. TSX Financials iShares (XFN.TO) have upside momentum and broke to an all-time high last Wednesday. BMO Equal Weight ETF (ZEB.TO) is testing its all-time high.
Special Situation Conclusion
- Lots of choices! Buy your favourite Canadian bank stock or buy your favourite Canadian Financial Services ETF (e.g. XFN, ZEB).
Following is a link to the show:
Trader Management 101
Basic rules on how to trade! Following is the link:
The MAJOR KEY To Become a Successful Trader (Proper Equity Management Explained) – YouTube
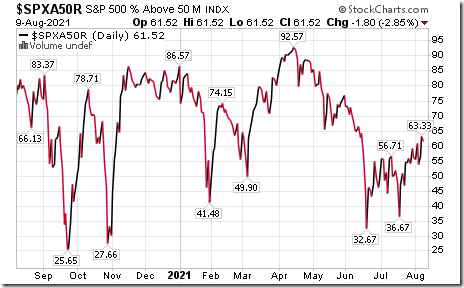
S&P 500 Momentum Barometers
The intermediate term Barometer slipped 1.80 to 61.52 yesterday. It remains Overbought.
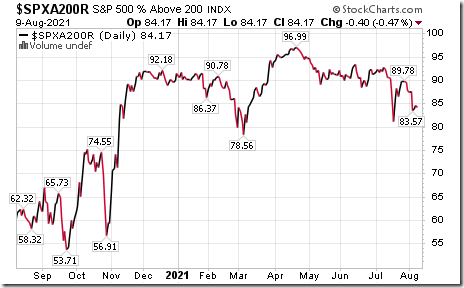
The long term Barometer eased 0.40 to 84.17 yesterday. It remains Extremely Overbought.
TSX Momentum Barometers
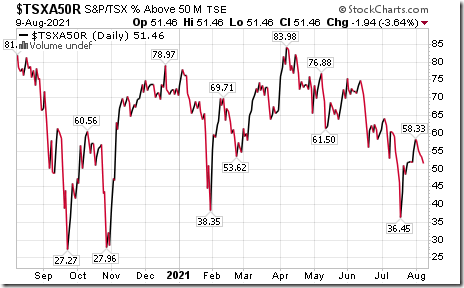
The intermediate term Barometer dropped 1.94 to 51.46 yesterday. It remains Neutral.
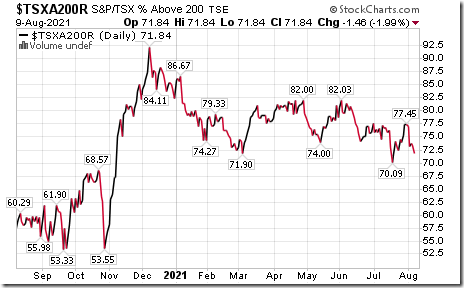
The long term Barometer slipped 1.46 to 71.84 yesterday. It remains Overbought.
Disclaimer: Seasonality and technical ratings offered in this report and at
www.equityclock.com are for information only. They should not be considered as advice to purchase or to sell mentioned securities. Data offered in this report is believed to be accurate, but is not guaranteed
This post was originally publised at Vialoux's Tech Talk.


