by Don Vialoux, EquityClock.com
The Bottom Line
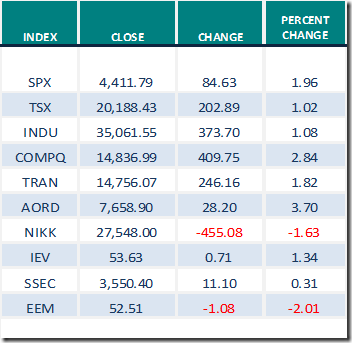
U.S. equity indices were slightly higher and the TSX Composite Index was slightly lower last week. Greatest influences remained the possibility of a fourth wave by COVID 19 (negative) and continued expansion of distribution of a COVID 19 vaccine (positive).
Observations
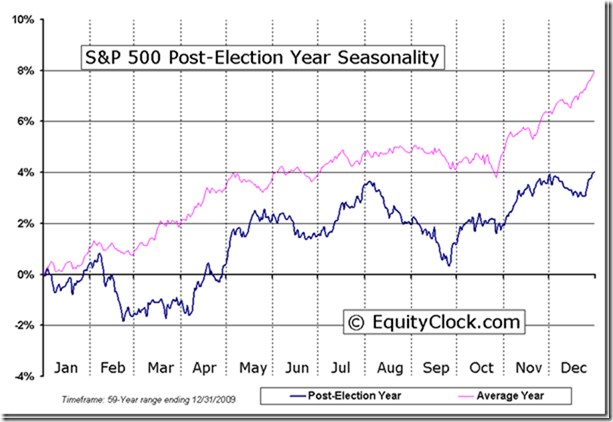
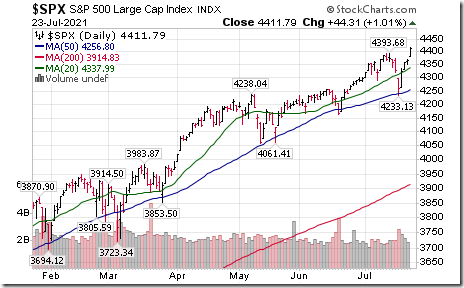
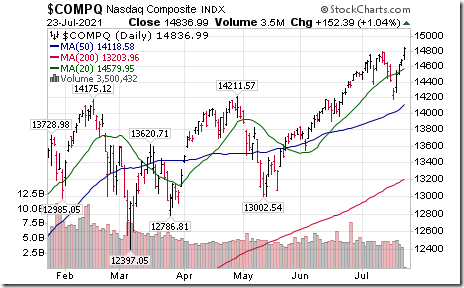
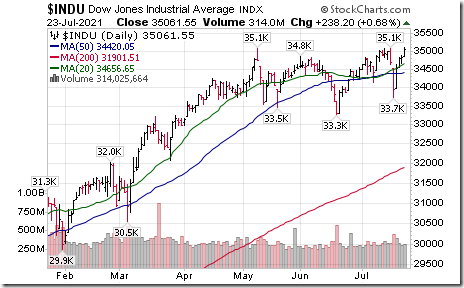
Favourable seasonal influences for U.S. equity markets to the end of July (particularly in a Post-U.S. Presidential Election year) returned last week. The S&P 500 Index, Dow Jones Industrial Average and the NASDAQ Composite Index briefly moved lower last Monday, but rallied to record all-time highs on Friday. Strength in July during Post-U.S. Presidential Election years is related to a “honey moon” period when investors anticipated launch of a new mandate by the President. Strength by U.S. equity markets last week was triggered by release of surprisingly strong second quarter results that overwhelmed growing COVID 19 concerns: Of the 24% of S&P 500 companies that released quarterly results to date, 88% exceeding consensus earnings estimates and 86% exceeding consensus revenue estimates. However, if history repeats, North American equity markets will reach an important intermediate top this week corresponding with a peak in frequency of quarterly earnings reports by major U.S. and Canadian companies.
Performances by equity indices outside of the U.S. were mixed last week. The Nikkei Average and Emerging Markets were slightly lower while the TSX Composite Index, Shanghai Composite Index and European equity indices were slightly higher.
Short term short term indicators for U.S. equity indices and sectors (20 day moving averages, short term momentum indicators) mostly moved higher last week.
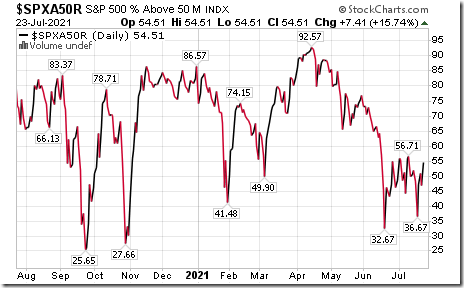
Intermediate term technical indicator for U.S. equity markets (e.g. Percent of S&P 500 stocks trading above their 50 day moving average) moved slightly higher last week, but remained Neutral. See Barometer charts at the end of this report.
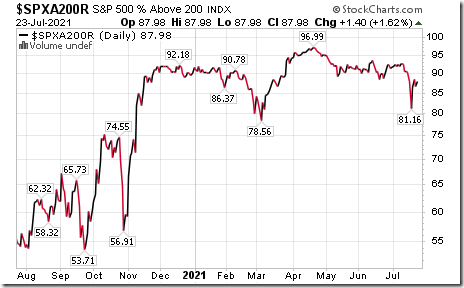
Long term technical indicator for U.S. equity markets (e.g. Percent of S&P 500 stocks trading above their 200 day moving average) were unchanged last week. It remained Extremely Overbought.. See Barometer chart at the end of this report.
Short term momentum indicators for Canadian indices and sectors were mixed last week.
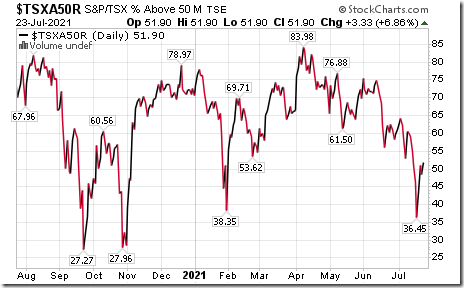
Intermediate term technical indicator for Canadian equity markets moved slightly higher last week. It remained Neutral. See Barometer chart at the end of this report.
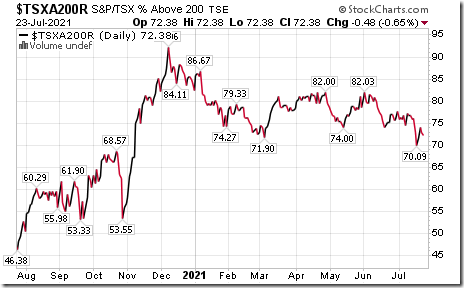
Long term technical indicator for Canadian equity markets (i.e. Percent of TSX stocks trading above their 200 day moving average) were virtually unchanged last week. It remained Overbought. See Barometer charts at the end of this report.
Consensus estimates for earnings by S&P 500 companies continued to increase from our report last week. According to www.FactSet.com earnings in the second quarter on a year-over-year basis are expected to increase 74.2% (versus previous estimate last week at 69.3%) and revenues are expected to increase 20.9% (versus previous estimate at 20.2%). Earnings in the third quarter are expected to increase 26.2% (versus previous estimate at 24.2%) and revenues are expected to increase 13.4% (versus previous estimate at12.7%. Earnings in the fourth quarter are expected to increase 20.3% (versus previous estimate at 18.6%) and revenues are expected to increase 10.1% (versus previous estimate at 9.5%). Earnings for all of 2021 are expected to increase 38.9% (versus previous estimate at 36.7%) and revenues are expected to increase 13.3% (versus previous estimate at 12.8%). Earnings in 2022 are expected to increase 11.0% (versus previous estimate at 11.0%) and revenues are expected to increase 6.7% (versus previous estimate at 6.8%.
Economic News This Week
June U.S. New Home Sales to be released at 10:00 AM EDT on Monday are expected to increase to 800.000 units from 769,000 units in May.
June Durable Goods Orders to be released at 8:30 AM EDT on Tuesday are expected to increase 2.1% versus a gain of 2.3% in May. Excluding aircraft orders, June Durable Goods Orders are expected to increase 0.8% versus a gain of 0.3% in May.
June Canadian Consumer Price Index to be released at 8:30 AM EDT on Wednesday is expected to increase 0.4% versus a gain of 0.5% in May. Excluding food and energy, June Consumer Price Index is expected to increase 0.4% versus a gain of 0.4% in May.
Fed Fund Rate to be updated at 2:00 PM EDT on Wednesday is expected to remain unchanged at 0.00%-0.25%. Conference call is held at 2:30 PM EDT.
Second quarter U.S. annualized real GDP to be released at 8:30 AM EDT on Thursday is expected to increase 8.6% from 6.4% in the first quarter.
June Personal Income to be released at 8:30 AM EDT on Friday is expected to drop 0.3% versus a decline of 2.0% in May. June Personal Spending is expected to increase 0.7% versus a gain of 0.9% in May.
May Canadian GDP to be released at 8:30 AM EDT on Friday is expected to drop 0.3% versus a decline of 0.3% in April.
July Chicago PMI to be released at 9:45 AM EDT on Friday is expected to drop to 63.5 from 66.1 in June.
July Michigan Consumer Sentiment Index to be released at 10:00 AM EDT is expected to remain unchanged at 80.8 in June.
Selected Earnings News This Week
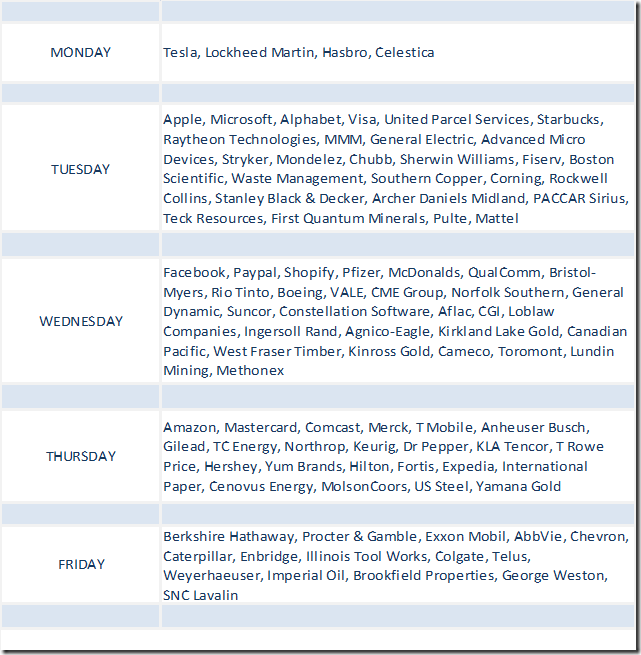
Frequency of second quarter reports by S&P 500 companies peaks this week. According to www.factset.com another 180 S&P 500 companies (including 10 Dow Jones Industrial Average companies) are scheduled to release results. In Canada, frequency of second quarter reports ramps up including reports from 17 of the TSX 60 companies.
Trader’s Corner
Equity Indices and Related ETFs
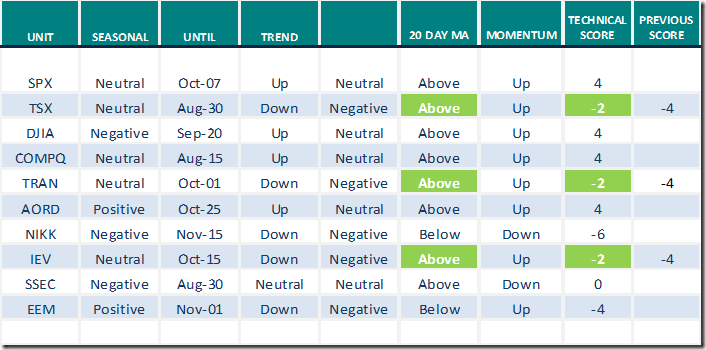
Daily Seasonal/Technical Equity Trends for July 23rd 2021
Green: Increase from previous day
Red: Decrease from previous day
Commodities
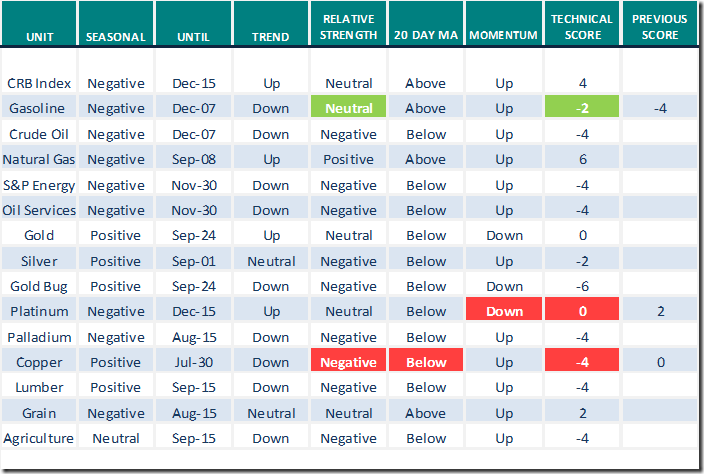
Daily Seasonal/Technical Commodities Trends for July 23rd 2021
Green: Increase from previous day
Red: Decrease from previous day
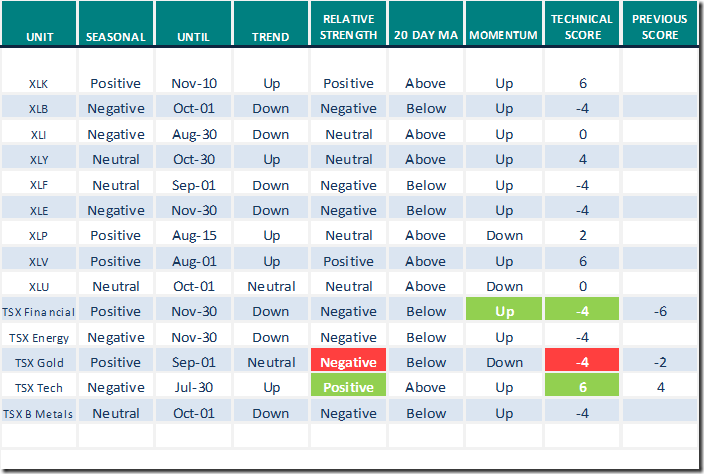
Sectors
Daily Seasonal/Technical Sector Trends for July 23rd 2021
Green: Increase from previous day
Red: Decrease from previous day
All seasonality ratings are based on performance relative to the S&P 500 Index
Charting the Second Half: Summer of Indigestion
By Tony Dwyer
https://www.youtube.com/watch?v=1dZKmWHu53I
Technical Scoop
Thank you to David Chapman and www.EnrichedInvesting.com for a link to their weekly comment
Notes and videos from uncommon Sense Investor
Thank you to Mark Bunting and www.uncommonsenseinvestor.com for links to the following reports and videos
Top Stock Ideas from BMO’s Brian Belski
Top Stock Ideas From BMO’s Brian Belski – Uncommon Sense Investor
Why Netflix’s stock is in Purgatory
Why Netflix’s Stock is in Purgatory – Uncommon Sense Investor
Technical Scores
Calculated as follows:
Intermediate Uptrend based on at least 20 trading days: Score 2
(Higher highs and higher lows)
Intermediate Neutral trend: Score 0
(Not up or down)
Intermediate Downtrend: Score -2
(Lower highs and lower lows)
Outperformance relative to the S&P 500 Index: Score: 2
Neutral Performance relative to the S&P 500 Index: 0
Underperformance relative to the S&P 500 Index: Score –2
Above 20 day moving average: Score 1
At 20 day moving average: Score: 0
Below 20 day moving average: –1
Up trending momentum indicators (Daily Stochastics, RSI and MACD): 1
Mixed momentum indicators: 0
Down trending momentum indicators: –1
Technical scores range from -6 to +6. Technical buy signals based on the above guidelines start when a security advances to at least 0.0, but preferably 2.0 or higher. Technical sell/short signals start when a security descends to 0, but preferably -2.0 or lower.
Long positions require maintaining a technical score of -2.0 or higher. Conversely, a short position requires maintaining a technical score of +2.0 or lower
Changes Last Week
Technical Notes released on Friday at
S&P 500 Index $SPX moved above $4,393.68 to an all-time high and its related ETF $SPY moved above $437.92 to an all-time high extending an intermediate uptrend.
NASDAQ Composite Index $COMPQ moved above $14,803.68 to an all-time high extending an intermediate uptrend.
Dow Jones Industrial Average $DJIA briefly moved above 35,091.56 to an all-time high extending an intermediate uptrend.
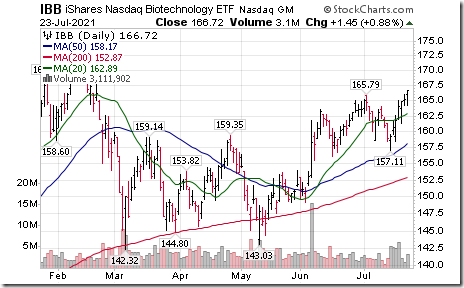
Biotech iShares $IBB moved above $165.79 extending an intermediate uptrend.
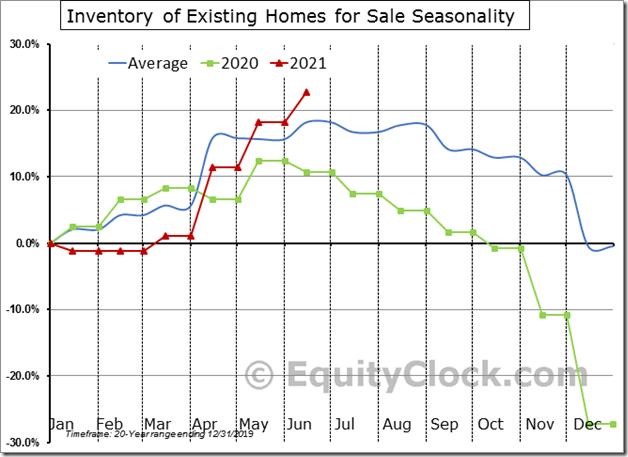
The inventory of homes for sale is starting to improve, allowing existing home sales to emerge from a multi-month slump of below average activity. equityclock.com/2021/07/22/… $ITB $XHB $DHI $LEN $PHM $STUDY #Economy #Housing
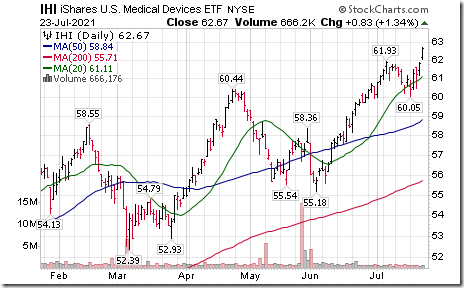
Medical Devices iShares $IHI moved above $61.93 to an all-time high extending an intermediate uptrend.
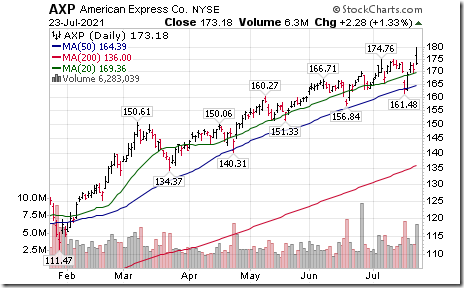
American Express $AXP a Dow Jones Industrial Average stock moved above $174.76 to an all-time high extending an intermediate uptrend.
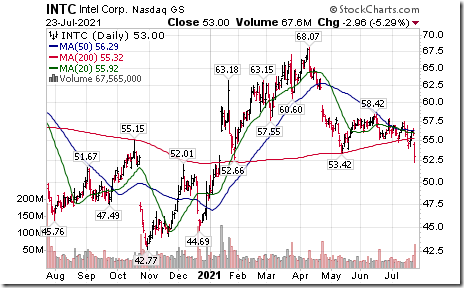
Intel $INTC a Dow Jones Industrial Average stock moved below $53.42 setting an intermediate downtrend.
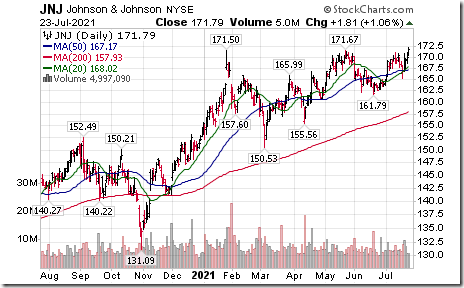
Johnson & Johnson $JNJ a Dow Jones Industrial Average stock moved above $171.67 to an all-time high extending an intermediate uptrend.
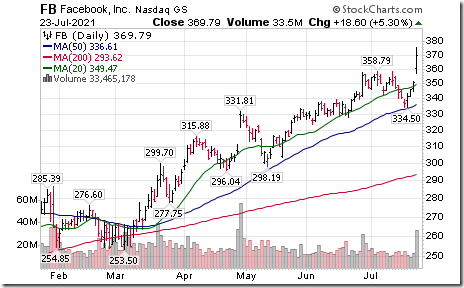
Facebook $FB an S&P 100 stock moved above $358.79 to an all-time high extending an intermediate uptrend.
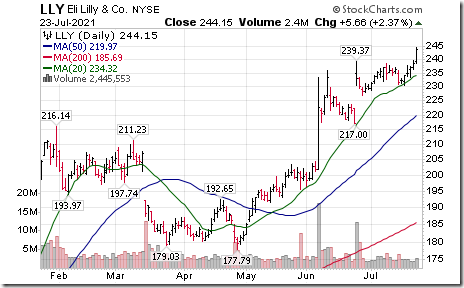
Eli Lilly $LLY an S&P 100 stock moved above $239.97 to an all-time high extending an intermediate uptrend.
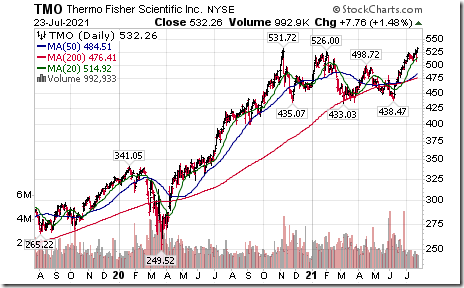
Thermo Fisher Scientific $TMO an S&P 100 stock moved above $531.72 to an all-time high extending an intermediate uptrend.
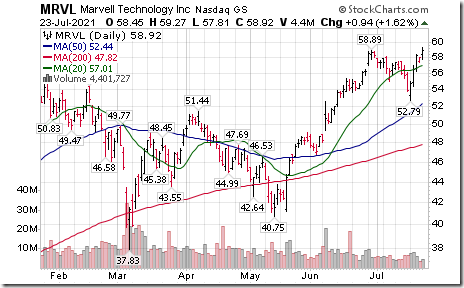
Marvell Technology $MRVL a NASDAQ 100 stock moved above $58.89 to an all-time high extending an intermediate uptrend.
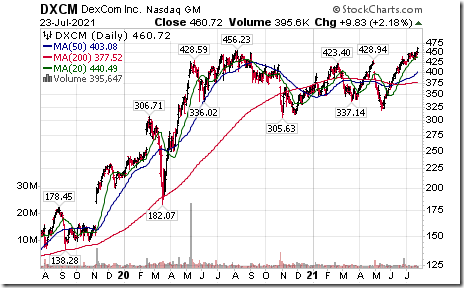
DexCom $DXCM a NASDAQ 100 stock moved above $456.23 to an all-time high extending an intermediate uptrend.
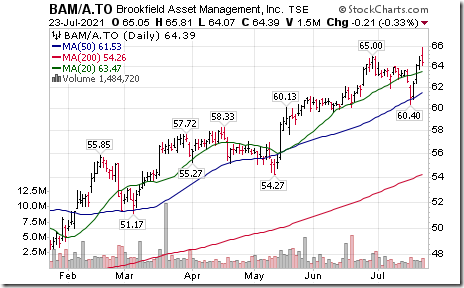
Brookfield Asset Management $BAM.A.CA a TSX 60 stock moved above $65.00 to an all-time high extending an intermediate uptrend.
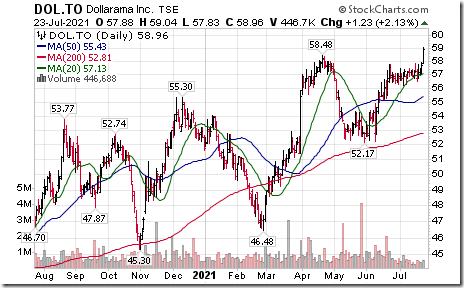
Dollarama $DOL.CA a TSX 60 stock moved above $58.53 to an all-time high extending an intermediate uptrend.
S&P 500 Momentum Barometers
The intermediate term Barometer added 7.41 on Friday and 6.21 last week to 54.51. It remains Neutral.
The long term Barometer added 1.40 on Friday and was unchanged last week to 87.98. It remains Extremely Overbought.
TSX Momentum Barometers
The intermediate Barometer added 3.33 on Friday and 5.57 last week to 51.90. It remains Neutral.
The long term Barometer slipped 0.48 on Friday and eased 0.56 last week. It remains Overbought.
Disclaimer: Seasonality and technical ratings offered in this report and at
www.equityclock.com are for information only. They should not be considered as advice to purchase or to sell mentioned securities. Data offered in this report is believed to be accurate, but is not guaranteed
This post was originally publised at Vialoux's Tech Talk.


