
by Craig Basinger, Derek Benedet, Chris Kerlow, Brett Gustafson, Richardson Wealth
2020 will certainly go down as one for the history books. From record highs that suddenly slammed into a pandemic-induced recession triggering the fastest bear market in history, immediately followed by perhaps the quickest market recovery in history. The difference between money made (or protected) or money lost, often came down to which week during the turmoil an investor traded. To put it into perspective, the S&P fell from 3,300 in early 2020 to 2,300 during the bear market and is now at 4,300. Closer to home, the TSX followed a similar pattern, from 17,500 to 11,500, and is now over 20,000. Maybe Canada’s Wonderland should name their next coaster ‘the market’, (although that probably would not be targeting the right clientele).
We would like to point out that, in aggregate, investors did a great job during this tumultuous period, especially compared to past bear markets. Previous bear markets often saw investors pulling money out of equities for 12-18 months after the market bottom, measuring fund flows. This was the typical pattern in the 1980s-2000s, and more recently in 2008, this pattern persisted (Chart 1). The shaded area is the cumulative equity fund flows which saw investors pull $250B out of equity vehicles very quickly. Of note, investors did not come back into the market for a number of years even as the equity markets (MSCI World is the purple line) started the long march back up.
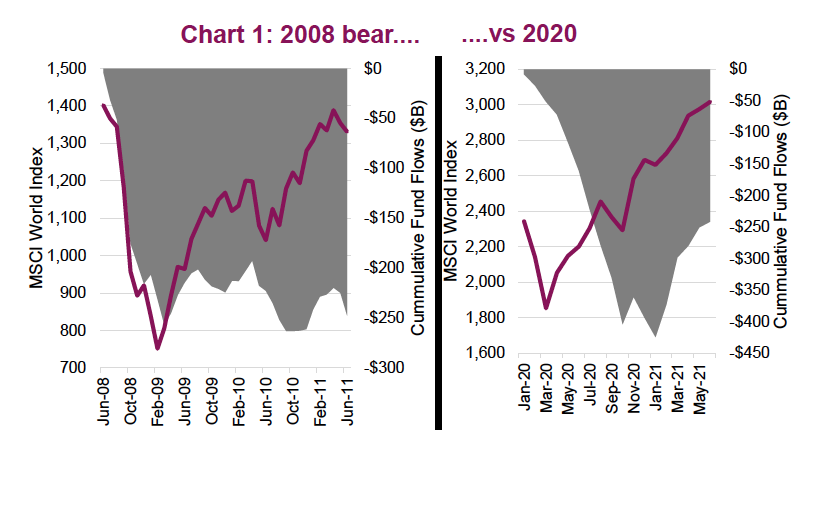 Contrast this with the right half of Chart 1. Investors did not sell during the tumble in any material fashion, instead they really started selling into the recovery rally. Perhaps this was because everything you read at the time opined that the market would put in a double bottom … well that didn’t work out. While $400B was pulled from equity funds and ETFs, this is probably a slight exaggeration. There has been increasing participation by the retail investor in individual equities. Some of the fund/ETF selling may have been redirected directly to equities, but investors were still net sellers into the market strength. The other big difference between past bears, in 2020 the investor started net buying a little less than a year after the bottom. Getting back into the market quicker than usual.
We don’t like drawing too many conclusions from 2020 give it was such a unique scenario, but it’s safe to say that investors did not capitulate as much as past bear markets, and started buying back into the market sooner. Well done!
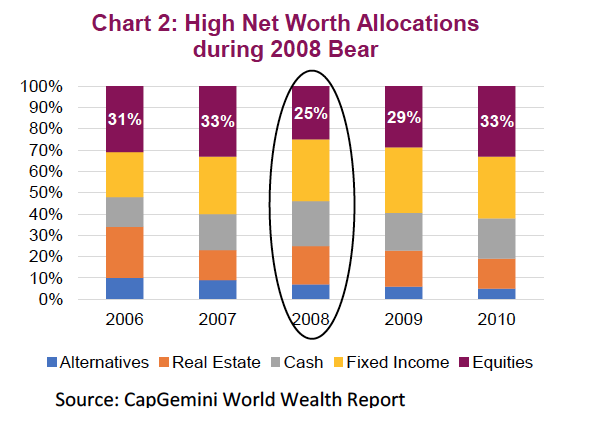
Improved tactical asset allocation shifts was also evident among high net worth individuals (HNWI) based on the CapGemini World Wealth Reports. In 2008, HNWI cut their equity allocations from 33% to 25% and reallocated mainly to cash (Chart 2). It took until the end of 2010, almost two years after the market bottomed, for the equity allocation to return to 33%.
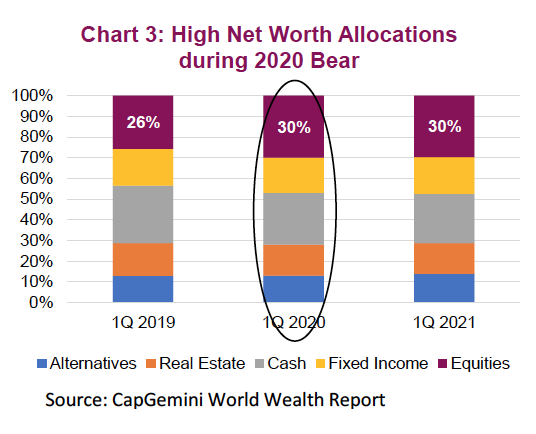
Turning to 2020 (Chart 3), the picture was very different. HNWI increased their equity allocations by the end of Q1 2020, taking advantage of the market weakness. The market bottomed a week before the end of Q1, and investors reduced cash to make this tactical equity investment.
Conclusion
Whether we look at aggregate fund flows or the tactical shifts in asset allocation among the high net worth, investors did a better job than normal during the 2020 bear market compared to past periods of market turmoil. Yes, the wealthier investors did an even better job – then again, maybe that is why they are wealthier. However, that is a much longer and very debatable topic.
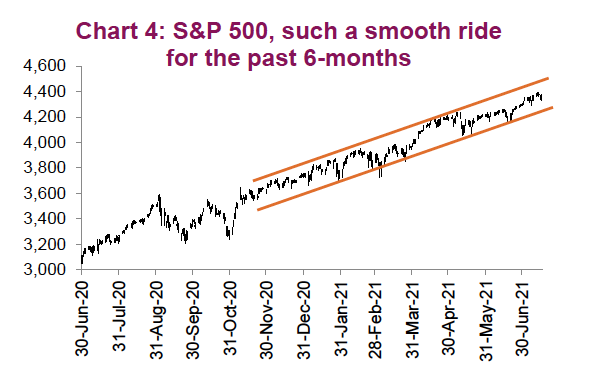
The success of the ‘buy any dip’ strategy has likely strengthened the resolve of investors who will view any weakness as a buying opportunity. Perhaps that is the reason the market has been steadily rising for six months with pullbacks maxing out in the low single digits (Chart 4). Certainly this is creating a pleasant investment environment; hope you are all enjoying it. Yet often the longer a period of tranquility, the bigger the inevitable shakeout.
Source: Charts are sourced to Bloomberg L.P. and Richardson Wealth unless otherwise noted.
The opinions expressed in this report are the opinions of the author and readers should not assume they reflect the opinions or recommendations of Richardson Wealth Limited or its affiliates. Assumptions, opinions and estimates constitute the author's judgment as of the date of this material and are subject to change without notice. We do not warrant the completeness or accuracy of this material, and it should not be relied upon as such. Before acting on any recommendation, you should consider whether it is suitable for your particular circumstances and, if necessary, seek professional advice. Past performance is not indicative of future results. The comments contained herein are general in nature and are not intended to be, nor should be construed to be, legal or tax advice to any particular individual. Accordingly, individuals should consult their own legal or tax advisors for advice with respect to the tax consequences to them, having regard to their own particular circumstances. Insurance services are offered through Richardson Wealth Insurance Services Limited in BC, AB, SK, MB, NWT, ON, QC, NB, NS, NL and PEI. Additional administrative support and policy management are provided by PPI Partners. Insurance products are not covered by the Canadian Investor Protection Fund.
Richardson Wealth Limited, Member Canadian Investor Protection Fund. Richardson Wealth is a trademark of James Richardson & Sons, Limited used under license.
Copyright © Richardson Wealth