
by Rick Rieder, CIO, Fixed Income, Blackrock
The pristine surface of a lake on a perfectly calm and sunny day is easy on the eyes. Yet it usually offers no insight as to what lies beneath. There is no indication of water depth, temperature, or aquatic flora and fauna in the glass-like surface, but instead a reflection of the surrounding land and sky – features that; while picturesque, have little to do with the inner workings of the lake’s ecosystem (see Figure 1). A curious passing hydrologist might be disappointed at this lack of surface-level information but would undoubtedly know to dive into the waters (or use high-tech equipment) to truly discover the secrets of the lake’s depths.
Figure 1: Mirror Lakes - Fiordland National Park, Milford Sound, New Zealand

Source: Photo by Navin Saigal, March 30, 2016
Similarly, the headlines around financial market events (especially in the post-pandemic economy) can sometimes conceal more than they reveal about the inner workings of the economy. In recent weeks, market participants have observed headlines of a “Payroll Miss” (June 4), an “Inflation Spike” (June 10) and a “Hawkish Fed” (June 16). However, the reality in the labor market is that there aren’t enough workers to fill vast quantities of open positions, resulting in slower than expected hiring (as opposed to a weak economy). Also, the inflation market is contending with used car price increases that account for much of the consumption basket’s gains (and are a result of temporary chip shortages in new car manufacturing), amidst historic base-effects against last year’s pandemic-driven trough in prices. Finally, the Federal Reserve (Fed) has done little more than recognize these realities and has suggested that the country is “on a path to a very strong labor market” (Chair Powell, June 16); commensurately making a modest tweak to the timing of expected rate hikes two years into the future. Interestingly, to imagine how dramatically things can change in two years, simply contrast one’s lifestyle in 2019 with the last 12 months. In each case, the simplistic headline masks a much more nuanced reality.
The Fed’s well-timed acknowledgement of eventual policy normalization is simply the next phase in a series of investment regimes that investors have had to navigate since the pandemic began last year (as we described in our recent piece Finding Some Real Perspective). The current investment regime, defined by the market pricing in more robust real growth potential, through higher real rates, started a few months ago, but in some ways had been postponed, as the Fed waited to see evidence of that growth in the data. The Fed’s comments at its June meeting nonetheless created huge swings in market pricing (in duration, inflation breakevens, the U.S. dollar, and the growth and value factors, to name a few), especially in crowded positions that were designed to take advantage of a “dovish Fed,” rather than a “hawkish Fed,” (or the emoji equivalents, should they exist). While some of these reactions may have been justified, the reality of the Fed’s decision-making process is much more complex than can be described in a simple emoji, or most of today’s news headlines.
It’s Critical to Understand the Complexity of Inflation Dynamics Today
How should the market interpret the fact that the U.S. “inflation deficit” from the pre-Covid trend has been cleared (see Figure 2)? Rather than bemoaning either debt-deflation, or hyperinflation, perhaps the market should instead recognize that long term growth and price stability have been created for decades through the supply side’s investment, rather than distorted monetary policy (we certainly think the Fed recognizes this).
Figure 2: The U.S. Covid “Inflation Deficit” Has Been Cleared
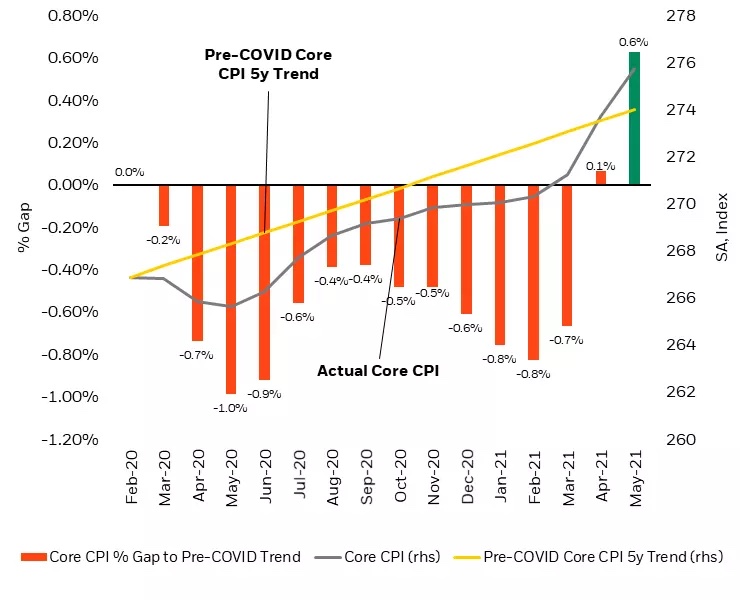
Sources: Bureau of Economic Analysis and Haver Analytics, data as of June 18, 2021
Take as an example the simple umbrella, which has essentially remained unchanged for more than 50 years. Many will recall the role of the iconic umbrella from the film “Mary Poppins,” and in the 54 years that it took Ms. Poppins to return (between the 1964 original and 2018’s “Mary Poppins Returns”), umbrella technology did not change – and neither did its price. In 1963, wholesale umbrella prices averaged between $1 and $4, according to a 1964 study by the United States Tariff Commission. Today, an umbrella can still be purchased for $1 from Walmart. We almost take these prices for granted, but how has the supply side been able to meet such demand growth at this price, particularly when world population has more than doubled, from 3.3 billion to 7.8 billion people (as per World Bank data, 2021) and global incomes have grown by more than 21x (from $555 to $11,442, as per MacroTrends data as of December 31, 2019).
The fact is that in the long run the aggregate supply curve has been extremely flexible and dynamic. The Fed is largely correct in identifying real economy price increases as transitory. Much of today’s inflation is due to reopening factors and chip shortages (as seen in the price spikes of new and used vehicles and displayed in Figure 3). The extremity and speed of the current economic cycle has understandably created inventory cycle inflation, most notably in the auto industry, but this will likely subside in time. It’s not structural, or sinister, but is rather a solvable temporary mismatch between demand and supply. And while cars aren’t exactly umbrellas, they do qualify as goods, and serve essentially the same function that they did 50 years ago as well. As supply chains normalize from Covid-related shocks and inventories are rebuilt, we expect much of recent inflation will be more transitory than permanent.
Figure 3: A Great Deal of Recent Inflation Stems From Transitory Factors
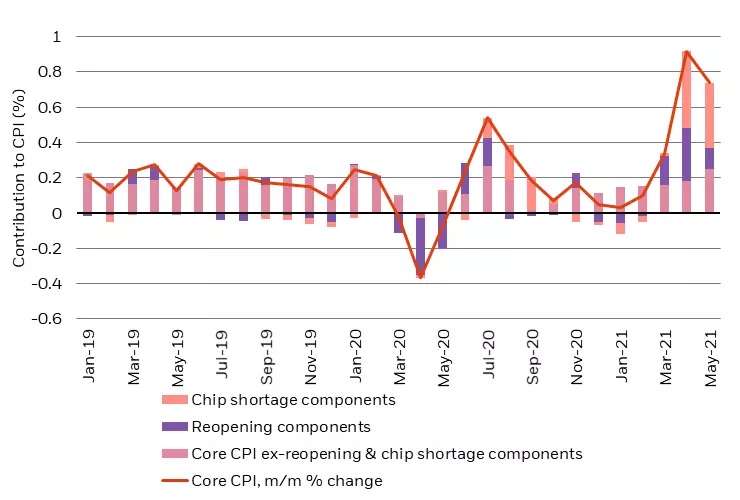
Sources: Bureau of Labor Statistics and Haver Analytics, data as of June 10, 2021
The trucking industry provides another great example of the supply side’s dynamism. Truckers are a large, but older employment group (with a median age ~51), and roughly half of U.S. truckers could be retiring in the next 10 to 15 years. But with autonomous driving technology improving exponentially (think Moore’s Law), we wonder whether true driverless trucks could be a reality in that time frame? If so, a productivity boost could ensue as retiring truckers are seamlessly replaced by automation, with no loss of output.
In the short term, the supply elasticity of labor and wage pressures are a bit more nuanced. Payroll misses aren’t reflecting a weak labor market, in our view – in fact, the labor market has been so strong that there aren’t enough participants to fill all the job vacancies (see Figure 4). Instead, we believe that part of the drop in participation is due to a larger than normal decline in the 65+ cohort, as Covid has likely pulled forward permanent retirements. None of that can be affected by monetary policy. Instead, one mitigating factor is likely to be Covid-era unemployment benefits rolling off – which should provide a tailwind to labor supply.
Figure 4: Many Businesses Report Difficulty Filling Jobs
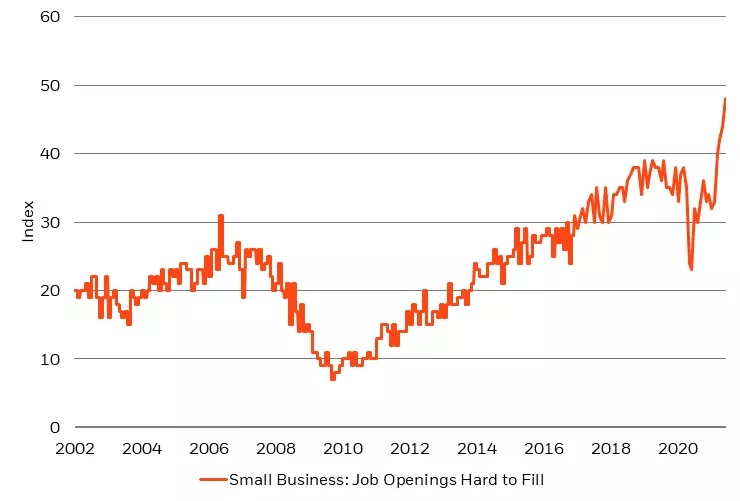
Sources: Bloomberg and BlackRock views, data as of June 2021
Looking beyond 2021-22’s labor recovery, we believe demographic stalling in labor force growth reinforces the need for productivity: headline productivity may be held down in the second half of 2021 by the return of service sector workers that were hardest hit, but those returning workers are a very good thing for our economy. Productivity gains can help alleviate inflation, and unemployment side-effects can be resolved through retraining. Continued targeted investment will go a long way toward expanding the supply side, particularly in areas like 5G connectivity and research and development (the U.S. needs to double its R&D spending to match China’s, as a share of GDP). In the long run, productivity gains can likely expand capacity in most industries faster than humans can create new demand, keeping prices contained. But rather than fearing disinflationary pressures, we think policymakers and markets ought to embrace them – especially if such disinflation comes in sectors that benefit the consumers, such that net disposable income rises as a result. Most commodities and goods-producing categories in the consumption basket fall into that bracket.
The Argument For Fed Asset Purchase Tapering
If inflation is not a long-term problem, why the need to taper or hike at all? We think that the use of emergency monetary policy during non-emergency conditions can destroy natural supply/demand balances in a manner that actually can hurt the economy and can risk serious imbalances in the long run. We need look no further than the housing market to see how this plays out: as a result of huge price gains through the pandemic, accompanied by easy policy, new home sales have fallen 23% while mortgage applications are down 24% since their peak earlier this year. In a very real sense, surging commodity prices (lumber, copper, etc.), skilled labor shortages and plunging home inventories have squeezed both builders and buyers alike.
The irony of overly aggressive monetary and fiscal policies can be severe if it’s allowed to overstay its welcome (as we wrote about in Inflation Conflation). In our housing example, eventually affordability falls, and sometimes dramatically, as do transaction volumes. We saw the impact of distorted market prices (from the opposite angle) in Manhattan real estate last year (Q2 2020), as lower prices, driven by an exodus from the city, led to a huge drop in sales volumes as sellers pulled their properties while trying to gauge the durability of these new and uncertain trends. Likewise, buyers evaporate when prices are too high, as we’ve seen in recent weeks through the rest of the country (see Figure 5).
Figure 5: Survey Measures of Home Purchasing Conditions Have Recently Plunged
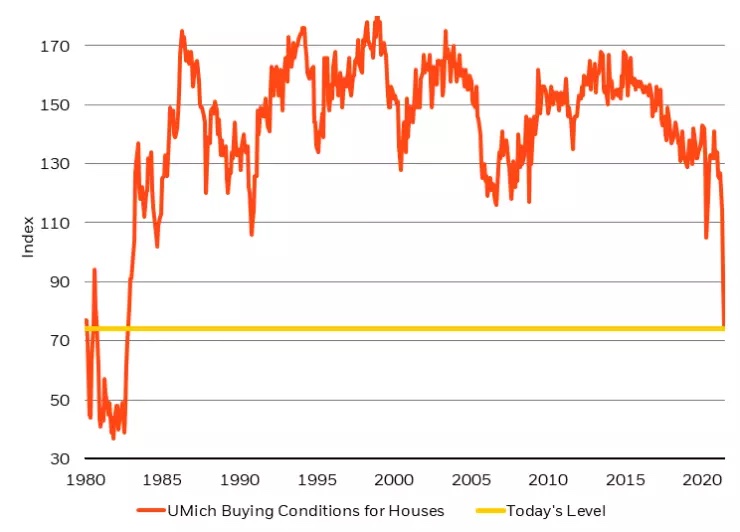
Source: Morgan Stanley, data as of June 22, 2021
Financial markets are no different – over the last year, distorted prices in the U.S. Treasury market have led to declining transaction volumes, as markets try to determine the fair value of real, nominal and inflation rates amidst an evolving economic and policy backdrop. In the days since the June FOMC meeting, we have seen up to 65% declines in some Treasury futures volumes (usually some of the most liquid markets on Earth). In our view, markets are much more comfortable taking risk and trading positions when the answers are simple and can be expressed as easily as a thumbs up (or thumbs down) emoji, but post-pandemic economic gyrations are much more complex than simple communications allow for.
So, What Does This Mean for Investing in the Second Half of 2021 (and Beyond)?
The undeniable strength in the economy should be the primary factor driving asset allocation, followed by perceived policy responses, and not the other way around. A strong revenue, earnings and mergers and acquisitions environment benefits the bottom part of the capital stack – namely equities. While credit has been bound by already low rates and very tight spreads, equities are unbounded by potential earnings growth. Earnings estimates are rocketing higher, set to more than double since just 2015 (see Figure 6). There is also likely to be more than $1.0 trillion of stock buybacks in the S&P 500 this year – more than all the annual coupon income in the U.S. Treasury, investment-grade and high yield markets combined!
Figure 6: S&P 500 Earnings Estimates Have Rocketed Higher
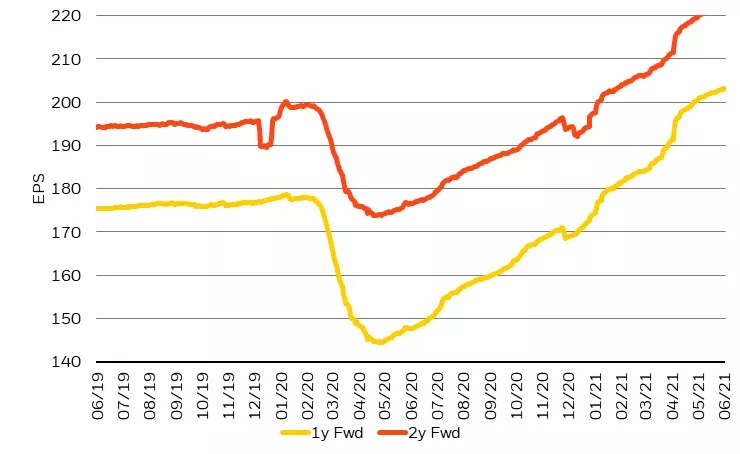
Sources: Bloomberg and BlackRock, data as of June 18, 2021
Yet valuations are richer than they have been, and policy liquidity may be pulling back later this summer (read more about policy liquidity’s influence in The Policy Liquidity Monopoly). While policy will be going from “emergency accommodation” to simply “easy” (nothing untoward, or pernicious, we believe), the transition could nonetheless dampen duration’s ability to hedge risky assets. Portfolios need to be handled with some caution, as the headwinds to duration mean that correlations between risk and rates likely remain unreliable – so duration may not serve as an effective hedge for now (see Figure 7). Higher yields (and a flatter yield curve) may induce some volatility as liquidity fades as well. Higher volatility can be reinforced if crowded positions build up around the belief that the Fed won’t move until 2023 – and those positions are unceremoniously unwound, like they were in the aftermath of the June FOMC meeting.
Figure 7: Stock/Bond Correlation Shifts Make Duration Less Reliable Hedge
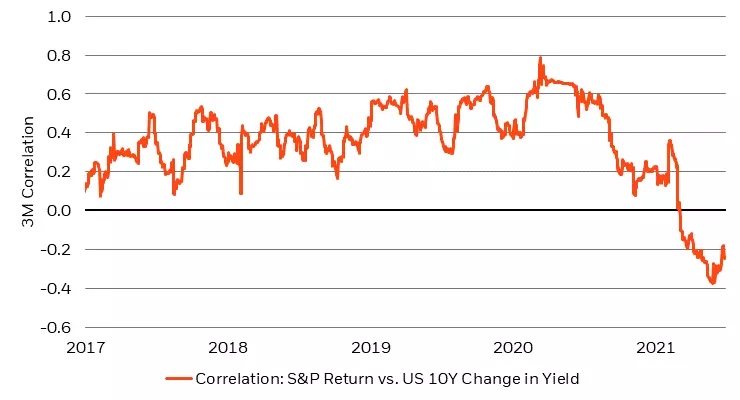
Sources: Bloomberg and BlackRock, data as of June 18, 2021
Last month we wrote in Investors’ Wants vs Needs that we would avoid negative real yielding high quality assets with poor convexity. The list of fixed income assets that fall in this bucket is a lengthy one, inhibiting forward return potential. Credit spreads tend to reach the tights in advance of growth peaking. Today, spreads are low and can hang in there, but there isn’t much space to tighten further, even if defaults stay low in a strong economy. Equities continue to appear relatively cheaper, with greater upside convexity.
Nonetheless, we would add to the list of “assets to avoid” those mediocre companies with excessive valuations that suggest market expectations of dramatic upside appreciation. We think consistent return on equity (ROE), and cash flow will most benefit our portfolios in the intermediate to long term. In fixed income markets, securitized assets stand out as still having reasonably attractive convexity, while short duration assets may suffer for some time, as policy normalization gets priced in.
While quick bursts of information and one-word answers often dominate the narrative, focusing on the emoji/tweet of the day can obscure the real drivers of return, just like glancing at the surface of a lake rarely reveals its underlying nature. Cash flow, relative to leverage and liquidity, are the tools we prefer when gauging the nature of an investment. A portfolio of companies with a high ROE can have lower leverage, higher free cash flows, higher margins and healthier levels of cash than a similar basket of low ROE companies. In today’s market environment, it’s vital for investors to dive deep enough below the surface to discover these gems.
 Rick Rieder
Rick Rieder, Managing Director, is BlackRock’s Chief Investment Officer of Global Fixed Income and is Head of the Global Allocation Investment Team.