by Don Vialoux, EquityClock.com
Technical Notes for yesterday
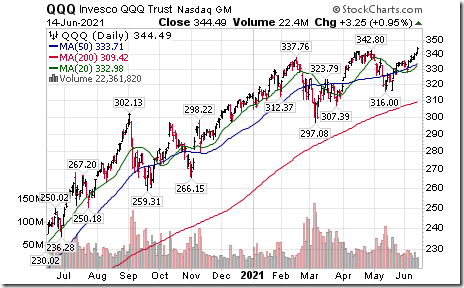
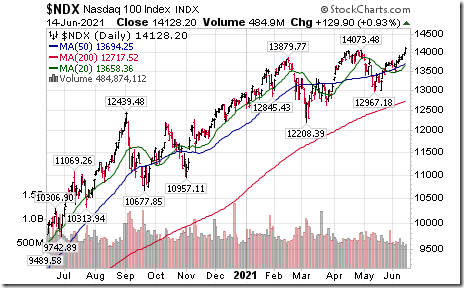
NASDAQ 100 Index $NDX moved above 14,073.48 to an all-time high and its related ETF $QQQ moved above $342.80 to an all-time high extending an intermediate uptrend.
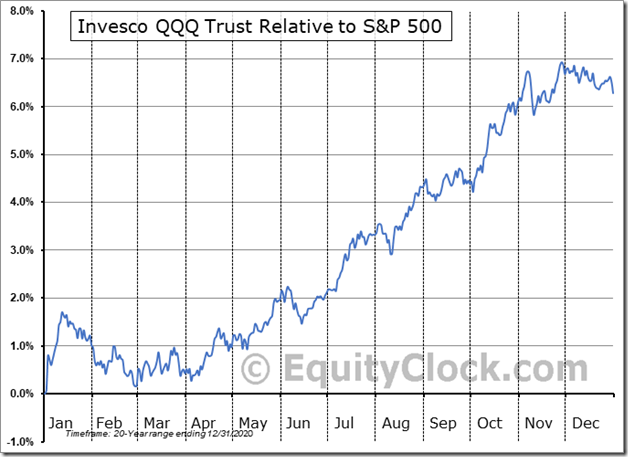
Seasonal influences for NASDAQ 100 ETF $QQQ relative to the S&P 500 Index are positive from mid-June to the end of November
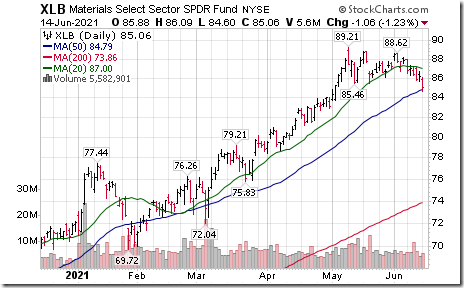
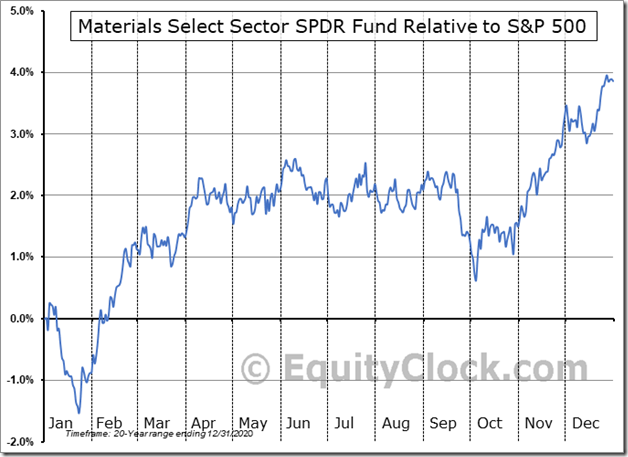
Materials SPDRs $XLB moved below $85.46 completing a double top pattern.
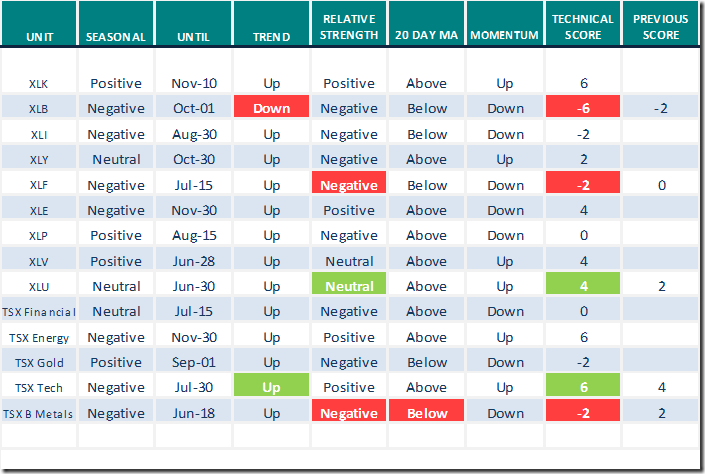
Seasonal influences for Materials SPDRs $XLB recently turned from Positive on a real and relative basis (relative to the S&P 500 Index) to Neutral on a real basis and negative on a relative basis to the beginning of October.
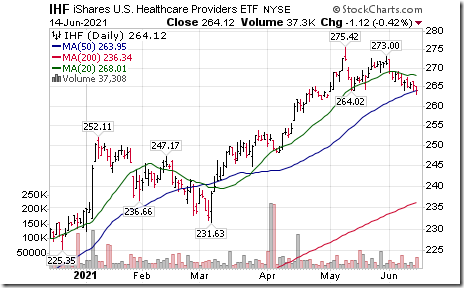
U.S. Health Care Providers iShares $IHF moved below $264.02 completing a double top pattern.
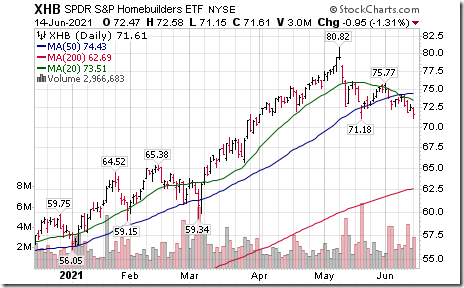
Home Builders SPDRs $XHB moved below $71.18 completing a double top pattern.
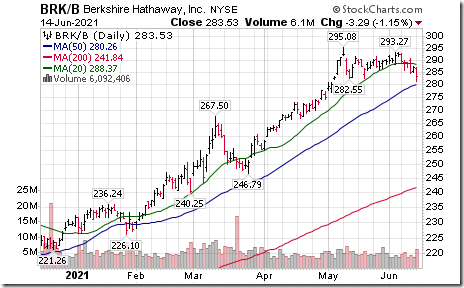
Berkshire Hathaway $BRK.B an S&P 100 stock moved below $282.55 completing a double top pattern.
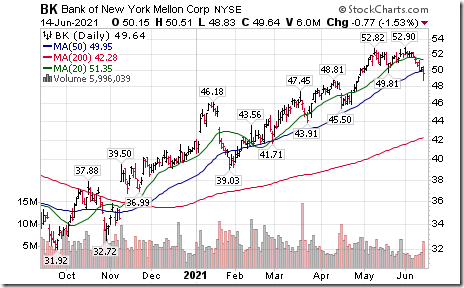
Bank of New York Mellon $BK an S&P 100 stock moved below $49.81 completing a double top pattern.
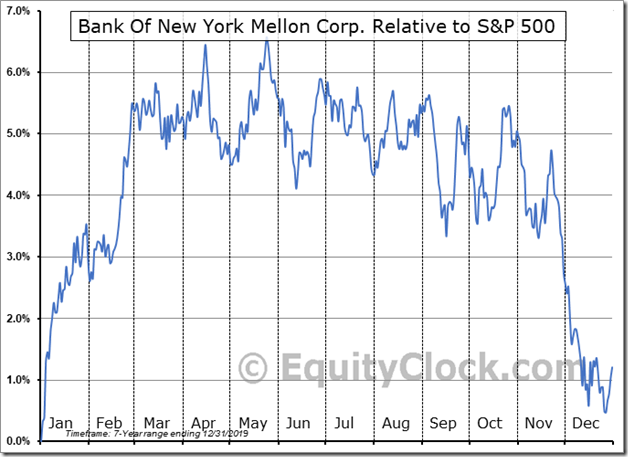
Seasonal influences for Bank of New York turned from Positive near the end of May to Neutral on a real basis and Negative on relative basis (relative to the S&P 500 to the third week in December
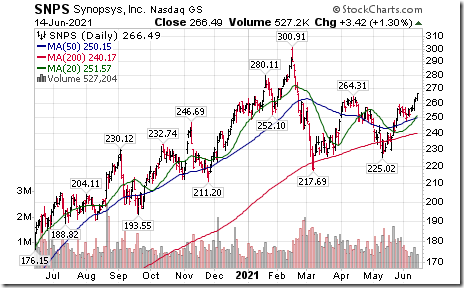
Synopsis $SNPS a NASDAQ 100 stock moved above $264.31 extending an intermediate uptrend.
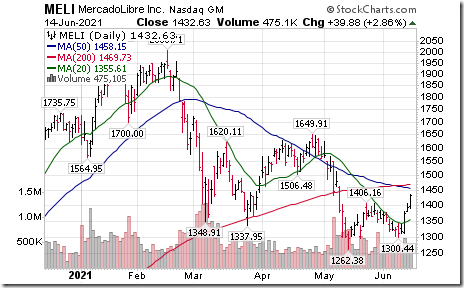
MercadoLibre $MELI a NASDAQ 100 stock moved above $1,406.16 completing a double bottom pattern.
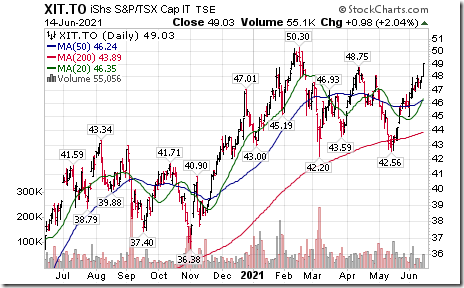
Cdn. Technology iShares $XIT.TO moved above $48.80 resuming an intermediate uptrend.
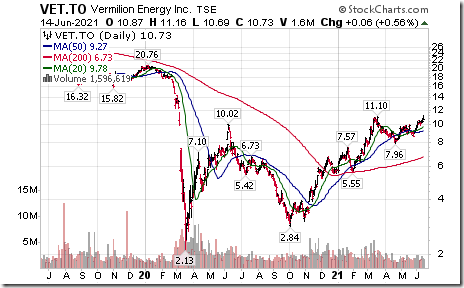
Canadian energy stocks continue to move higher on rising crude oil and natural gas prices. Nice breakout by Vermillion Energy $VET.CA to a 15 month high extending an intermediate uptrend!
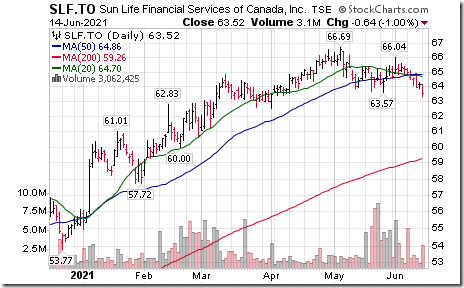
Sun Life Financial $SLF.CA a TSX 60 stock moved below $63.57 completing a double top pattern.
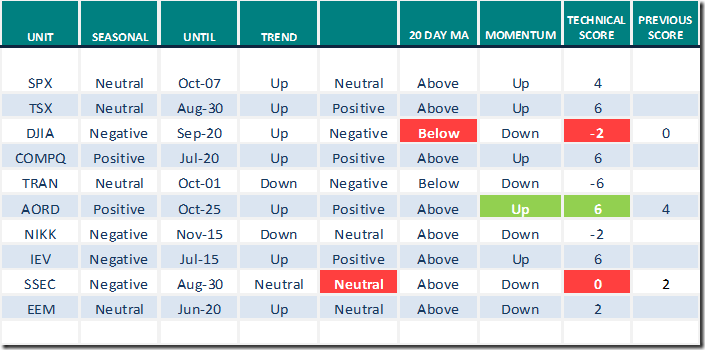
Equity Indices and Related ETFs
Daily Seasonal/Technical Equity Trends for June 14th 2021
Green: Increase from previous day
Red: Decrease from previous day
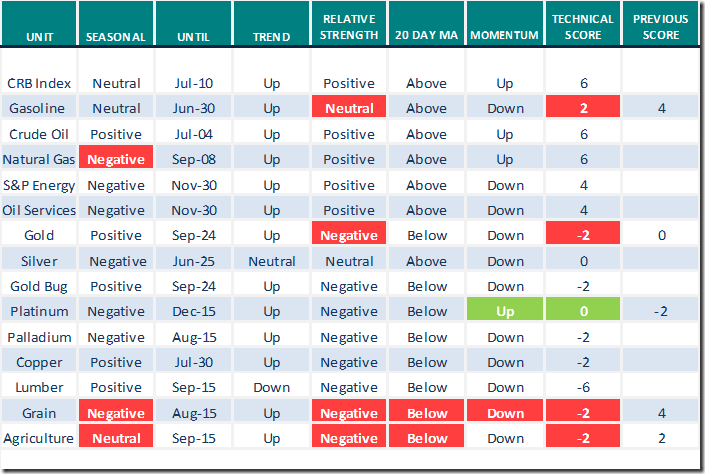
Commodities
Daily Seasonal/Technical Commodities Trends for June 14th 2021
Green: Increase from previous day
Red: Decrease from previous day
Sectors
Daily Seasonal/Technical Sector Trends for June 14th 2021
Green: Increase from previous day
Red: Decrease from previous day
All seasonality ratings are based on performance relative to the S&P 500 Index
Changes in Seasonality Ratings
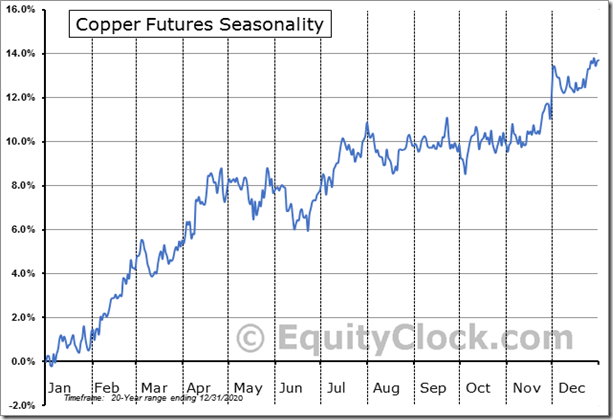
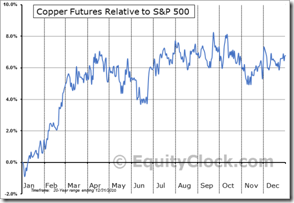
Copper futures change from Negative in mid-June to Positive on a real and relative basis to the end of July.
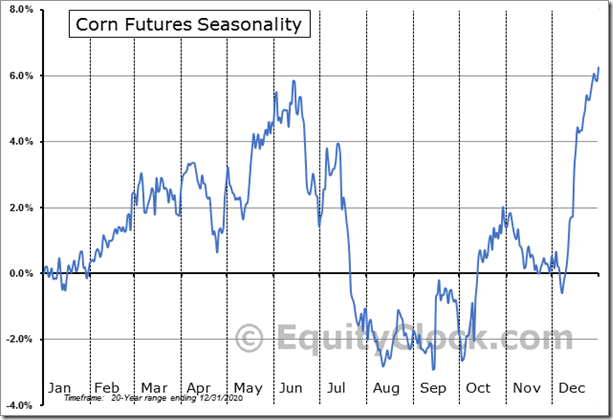
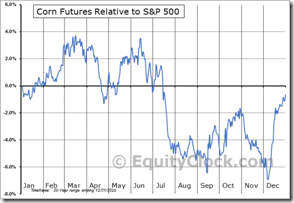
Grain futures (Corn, Soybeans,Wheat) turn from Positive in mid-June to Negative to the middle of August on a real and relative basis.
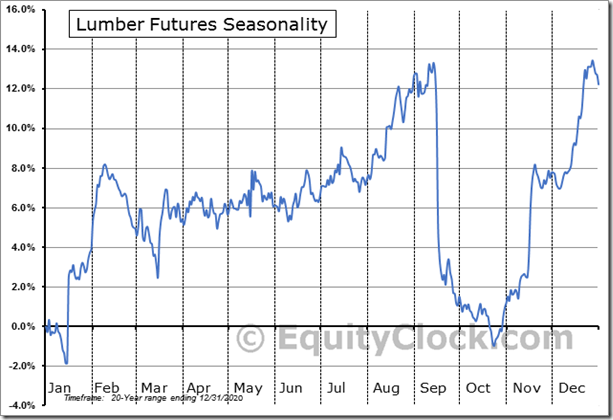
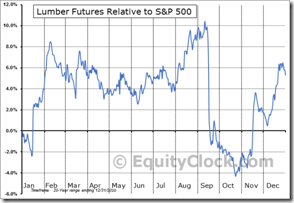
Lumber futures change from Neutral in mid-June to Positive to mid-September on a real and relative basis.
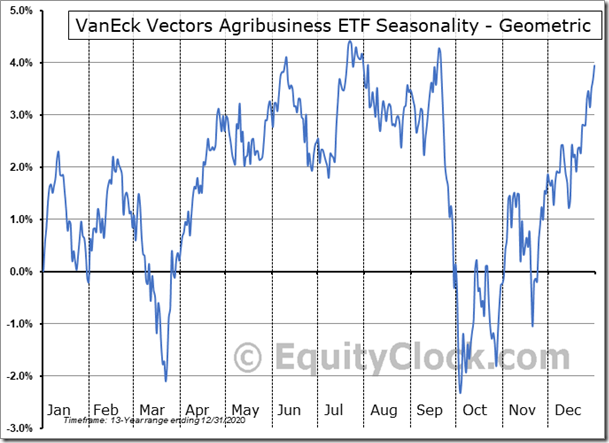
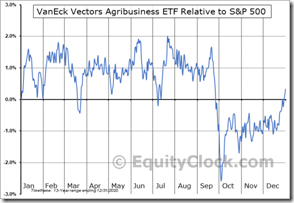
Agriculture changes from Positive to mid-June to Neutral to mid-September on a real and relative basis.
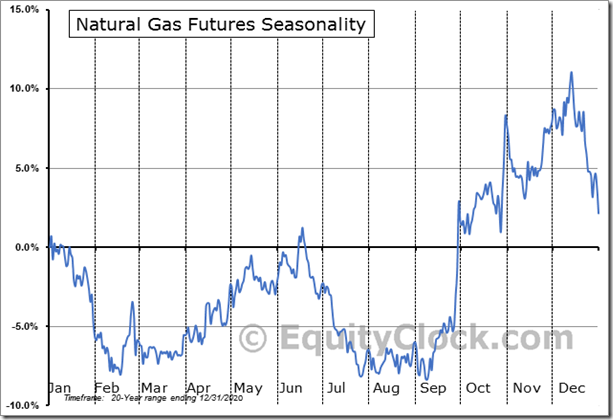
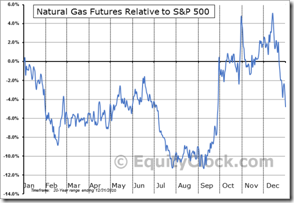
Natural Gas futures change from Positive to mid-June to Negative to first week inSeptember on a real and relative basis.
S&P 500 Momentum Barometers
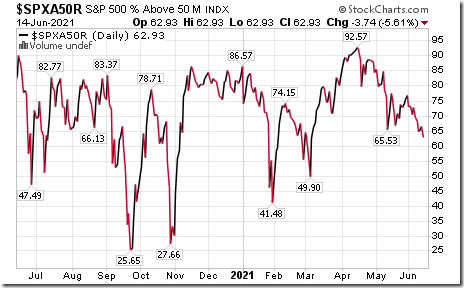
The intermediate Barometer dropped 3.74 to 62.93 yesterday. It remains Overbought and is trending down.
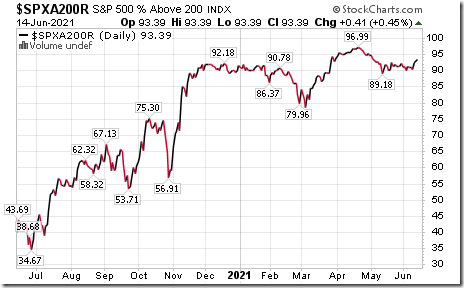
The long term Barometer added 0.41 to 93.39 yesterday. It remains Extremely Overbought.
NASDAQ 100 Momentum Barometers
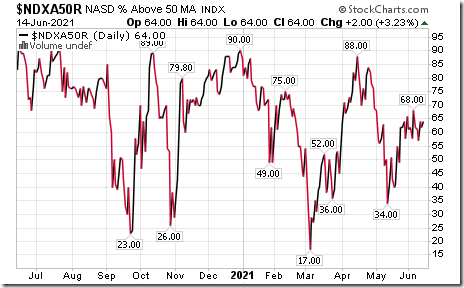
The intermediate Barometer gained 2.00 to 64.00 yesterday. It remains Overbought and is trending upward.
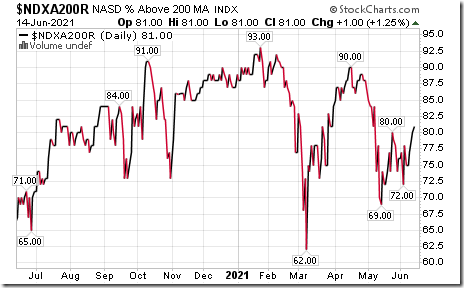
The long term Barometer gained 1.00 to 81.00 yesterday. It remains Extremely Overbought, but is trending upward.
TSX Momentum Barometers
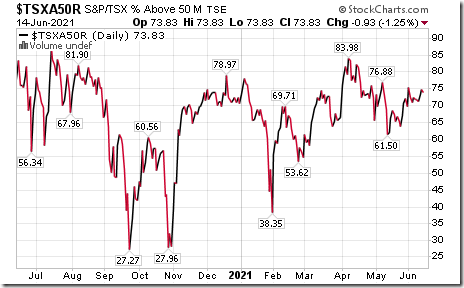
The intermediate Barometer slipped 0.93 to 73.83 yesterday. It remains Overbought.
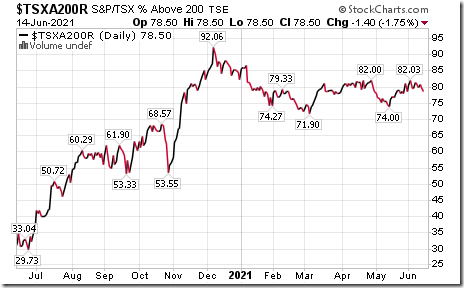
The long term Barometer slipped 1.40 to 78.50 yesterday. It remains Overbought.
Disclaimer: Seasonality and technical ratings offered in this report and at
www.equityclock.com are for information only. They should not be considered as advice to purchase or to sell mentioned securities. Data offered in this report is believed to be accurate, but is not guaranteed
This post was originally publised at Vialoux's Tech Talk.


