

After spending three years from early 2017 to early 2020 in the red unfavored zone of the SIA S&P 500 Index Report, oilfield service provider Halliburton (HAL) has spent most of the last year in the Green Favored Zone. Yesterday, HAL finished in 102nd place, up 21 spots on the day and up 274 spots in the last month.
Climbing up off another higher low that kept their underlying uptrend intact, Halliburton (HAL) shares closed at their highest level in over two years yesterday. The shares are currently sitting just below the $25.00 round number, where a breakout would complete a bullish Ascending Triangle base which has been forming for over a year now and would confirm the start of a new advance.
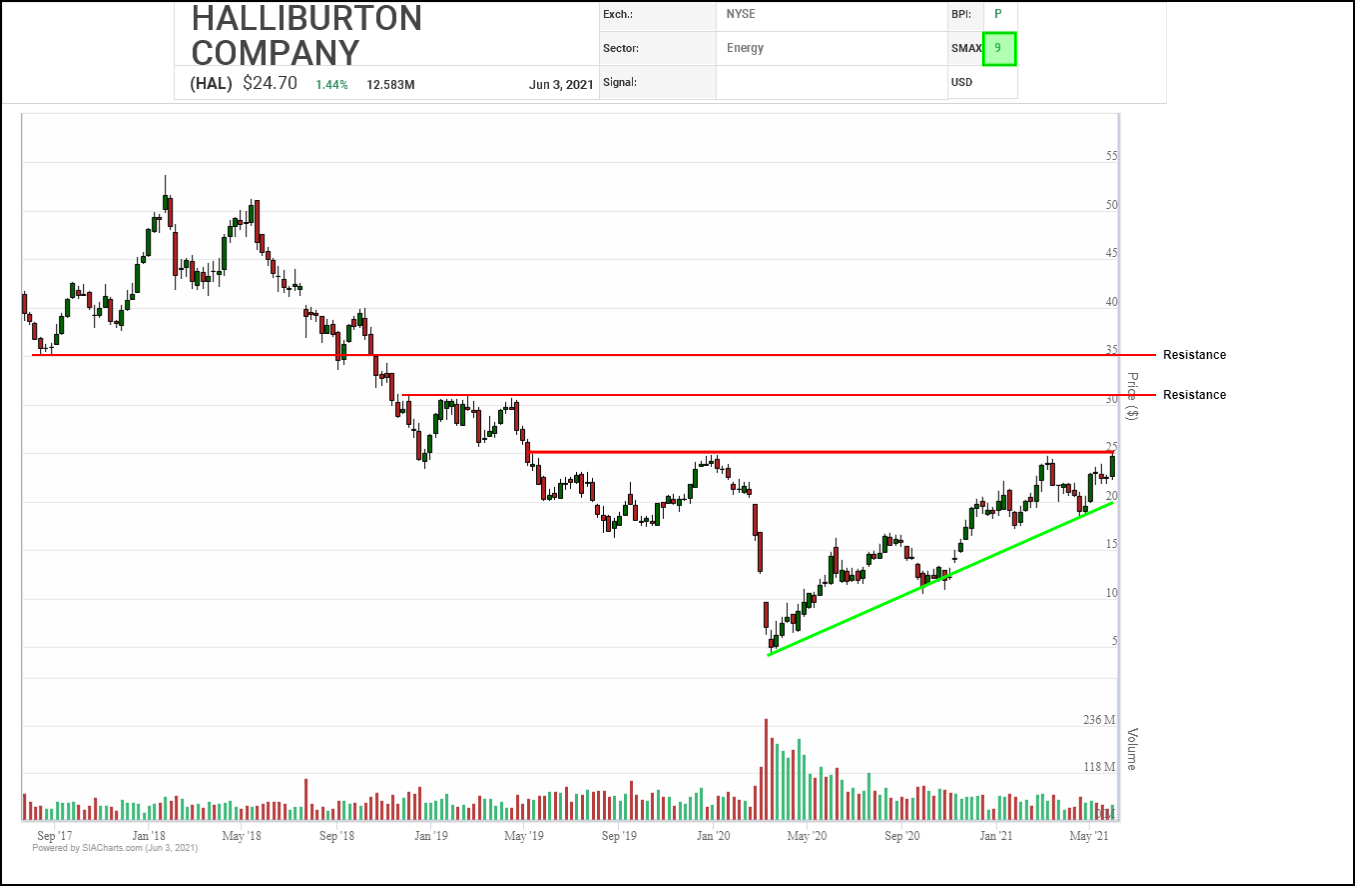
Should that occur, next potential upside resistance would appear in the $31.00 to $32.00 area based on measured moves off of recent lows and a place where the shares faltered previously, followed by the $35.00 round number. Initial support currently appears near $22.25 then $22.00.
Back in the winter, Halliburton (HAL) snapped a long-term downtrend line, then paused to consolidate for about three months. This week, the shares have broken out to the upside, completing bullish Double Top and Spread Double Top patterns, signaling that accumulation has resumed and a new upleg has commenced.
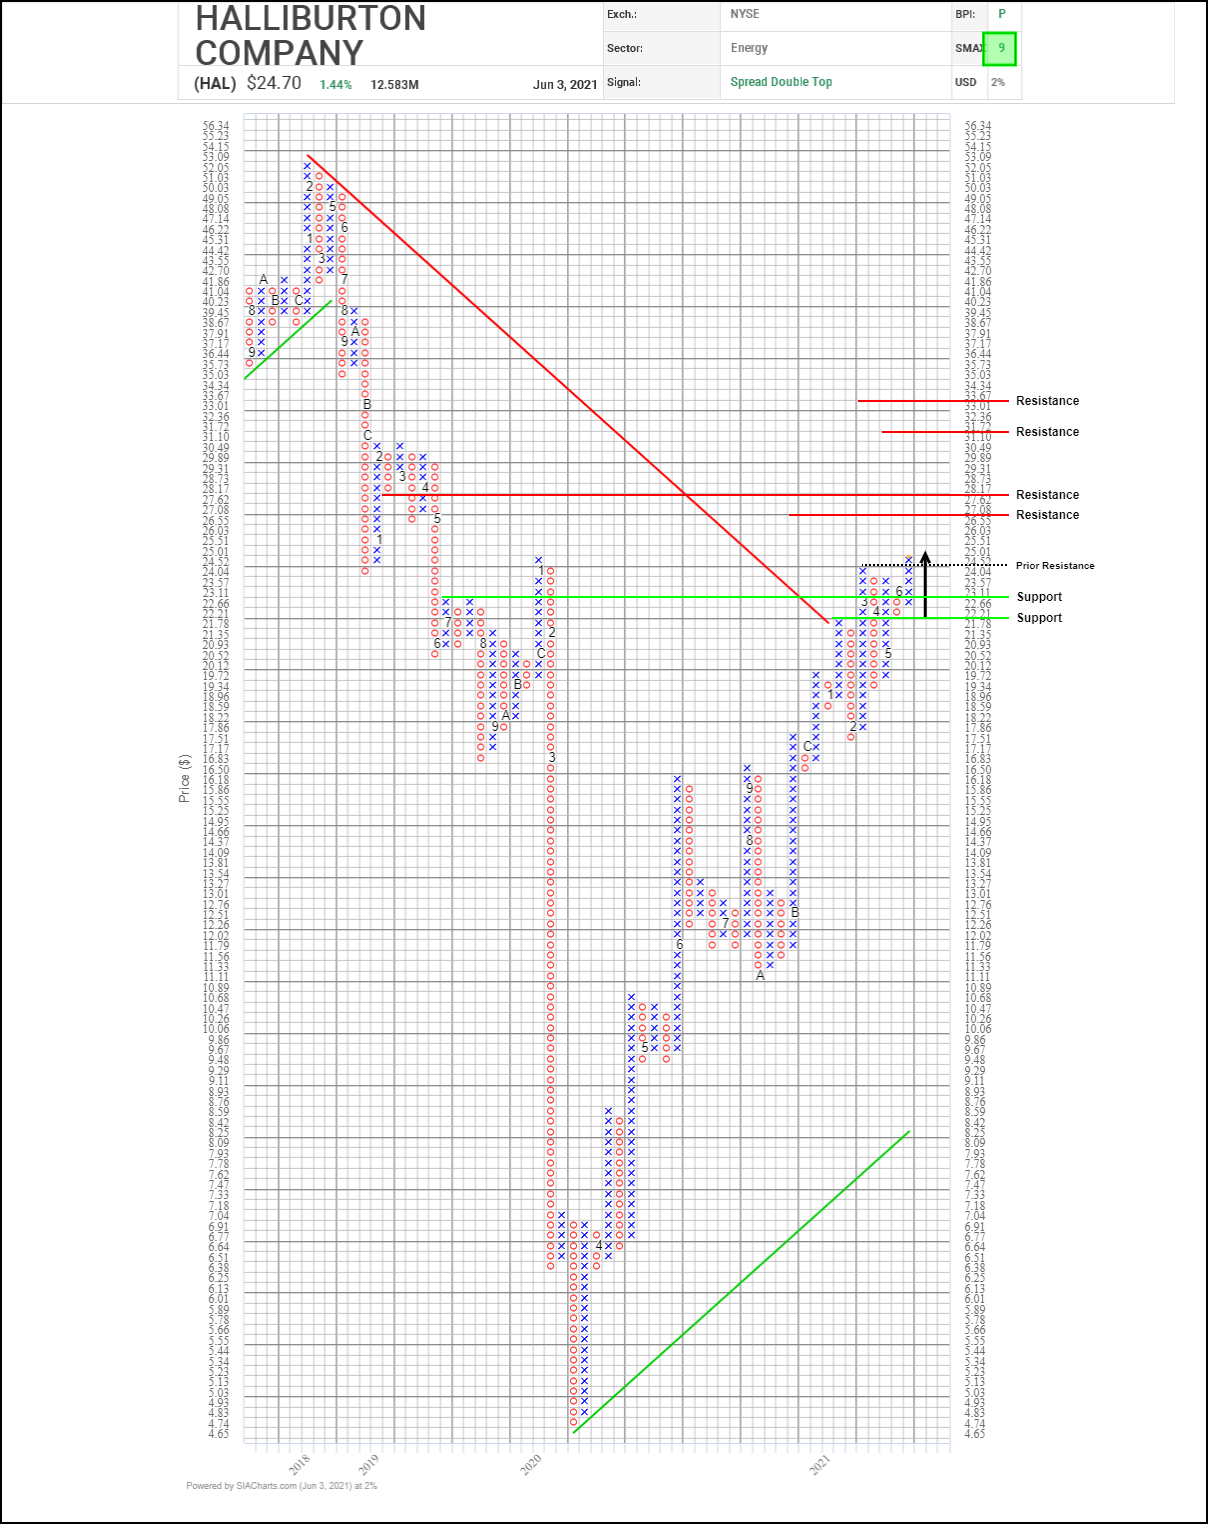
Based on a series of vertical and horizontal counts, sometimes combined with previous column highs and lows, next potential upside resistance tests on trend appear near $27.10, $28.20, $31.70, and $33.65. Initial support appears near $22.65 based on a 3-box reversal.
With a bullish SMAX score of 9, HAL is exhibiting strength across the asset classes.
Disclaimer: SIACharts Inc. specifically represents that it does not give investment advice or advocate the purchase or sale of any security or investment whatsoever. This information has been prepared without regard to any particular investors investment objectives, financial situation, and needs. None of the information contained in this document constitutes an offer to sell or the solicitation of an offer to buy any security or other investment or an offer to provide investment services of any kind. As such, advisors and their clients should not act on any recommendation (express or implied) or information in this report without obtaining specific advice in relation to their accounts and should not rely on information herein as the primary basis for their investment decisions. Information contained herein is based on data obtained from recognized statistical services, issuer reports or communications, or other sources, believed to be reliable. SIACharts Inc. nor its third party content providers make any representations or warranties or take any responsibility as to the accuracy or completeness of any recommendation or information contained herein and shall not be liable for any errors, inaccuracies or delays in content, or for any actions taken in reliance thereon. Any statements nonfactual in nature constitute only current opinions, which are subject to change without notice.