
by Guggenheim Partners
Core CPI jumped to 3.0 percent year-over-year in April, the fastest pace since 1996. While the base effect from low readings in April 2020 was widely expected by markets, the monthly pace of inflation also rose notably. Core CPI increased 0.92 percent from March to April, the largest monthly gain since 1981.
The market seems to think this may be the start of an enduring trend of higher inflation, given record fiscal stimulus, ultra-easy Federal Reserve (Fed) accommodation, and ongoing supply bottlenecks. But a closer look at the data suggests that this spike in prices is a one-time adjustment as the economy reopens.
Spooked bond investors pulled forward Fed rate hike expectations after the CPI release, despite the Fed repeatedly emphasizing that they view this reopening-induced rise in prices as transitory. Investors should believe the Fed when they say they will look through this temporary inflation noise and fade the bond selloff.
The month-to-month gains in the core CPI were largely driven by a few small categories related to economic reopening and temporary pandemic-induced shortages. 54 of the 92 basis point increase came from used cars, rental cars, airfares, and hotels, despite these categories having a weight of just 5 percent in the core CPI basket. The contribution was so large because the monthly price increases were so huge (e.g. 10 percent gain in used car prices). These increases are unlikely to be sustained beyond the next few months, especially once prices in depressed categories recover back to the pre-COVID trend.
Small, Temporary Factors Boosted April CPI
Contribution to Monthly Percent Change in Core CPI
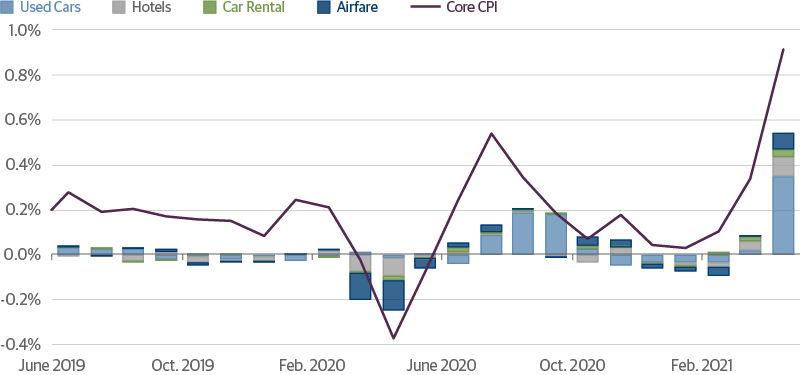
Source: Guggenheim Investments, Haver Analytics. Data as of 4.30.2021.
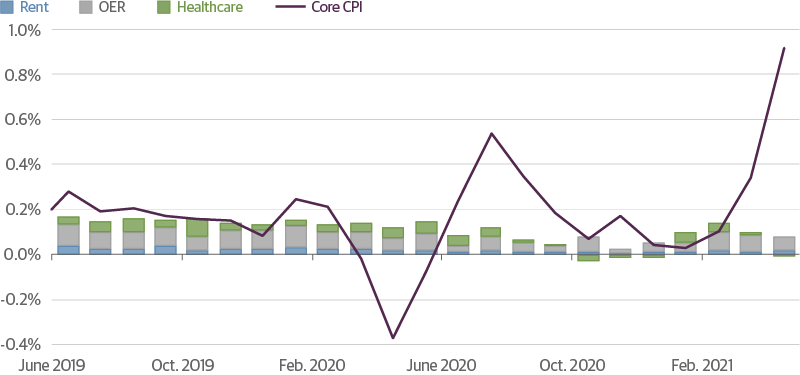
To the Fed, what matters is the trend in the larger, more durable inflation categories that influence the longer-term inflation outlook. In those categories, sequential inflation was much more muted: rents (including owners’ equivalent rent) and healthcare services contributed just 8 basis points to the monthly gain, despite making up 49 percent of the core CPI index. The Fed is more focused on the chart below than the chart above—and the bond market should be too.
Larger, More Durable Inflation Categories Remain Tame
Contribution to Monthly Percent Change in Core CPI
.png.aspx)
Source: Guggenheim Investments, Haver Analytics. Data as of 4.30.2021. OER is owner's equivalent rent.
From the Office of the Global Chief Investment Officer, Scott Minerd
By the Guggenheim Investments Macroeconomic and Investment Research Group
- Brian Smedley, Chief Economist and Head of Macroeconomic and Investment Research
- Matt Bush, CFA, CBE, U.S. Economist, Macroeconomic and Investment Research
Important Notices and Disclosures
Investing involves risk, including the possible loss of principal. Investments in fixed-income instruments are subject to the possibility that interest rates could rise, causing their values to decline. High yield and unrated debt securities are at a greater risk of default than investment grade bonds and may be less liquid, which may increase volatility.
Basis point – One basis point is equal to 0.01 percent.
This material is distributed or presented for informational or educational purposes only and should not be considered a recommendation of any particular security, strategy or investment product, or as investing advice of any kind. This material is not provided in a fiduciary capacity, may not be relied upon for or in connection with the making of investment decisions, and does not constitute a solicitation of an offer to buy or sell securities. The content contained herein is not intended to be and should not be construed as legal or tax advice and/or a legal opinion. Always consult a financial, tax and/or legal professional regarding your specific situation.
This material contains opinions of the author, but not necessarily those of Guggenheim Partners or its subsidiaries. The opinions contained herein are subject to change without notice. Forward looking statements, estimates, and certain information contained herein are based upon proprietary and non-proprietary research and other sources. Information contained herein has been obtained from sources believed to be reliable, but are not assured as to accuracy. No part of this material may be reproduced or referred to in any form, without express written permission of Guggenheim Partners, LLC. There is neither representation nor warranty as to the current accuracy of, nor liability for, decisions based on such information. Past performance is not indicative of future results.
Guggenheim Investments represents the following affiliated investment management businesses: Guggenheim Partners Investment Management, LLC, Security Investors, LLC, Guggenheim Funds Distributors, LLC, Guggenheim Funds Investment Advisors, LLC, Guggenheim Corporate Funding, LLC, Guggenheim Partners Europe Limited, Guggenheim Partners Fund Management (Europe) Limited, Guggenheim Partners Japan Limited, GS GAMMA Advisors, LLC, and Guggenheim Partners India Management.