
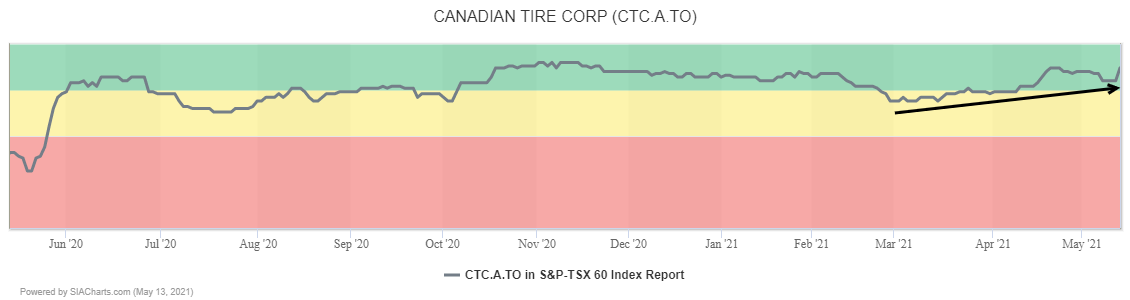
Since we last mentioned Canadian Tire* in the April 19th edition of the Daily Stock Report, the shares have gained 9.4%. They also have continued to climb within the Green Favored Zone of the SIA S&P/TSX 60 Index Report, including moving up another 4 spots yesterday to 8th place.
For over a year, Canadian Tire* (CTC.A.TO) shares have been under steady accumulation, advancing in a step pattern of rallies followed by periods of consolidation at higher levels. Last fall, the shares broke out over $150.00, overcoming resistance that had been in place since 2018 and completed a bullish Ascending Triangle base, confirming the start of a new uptrend.
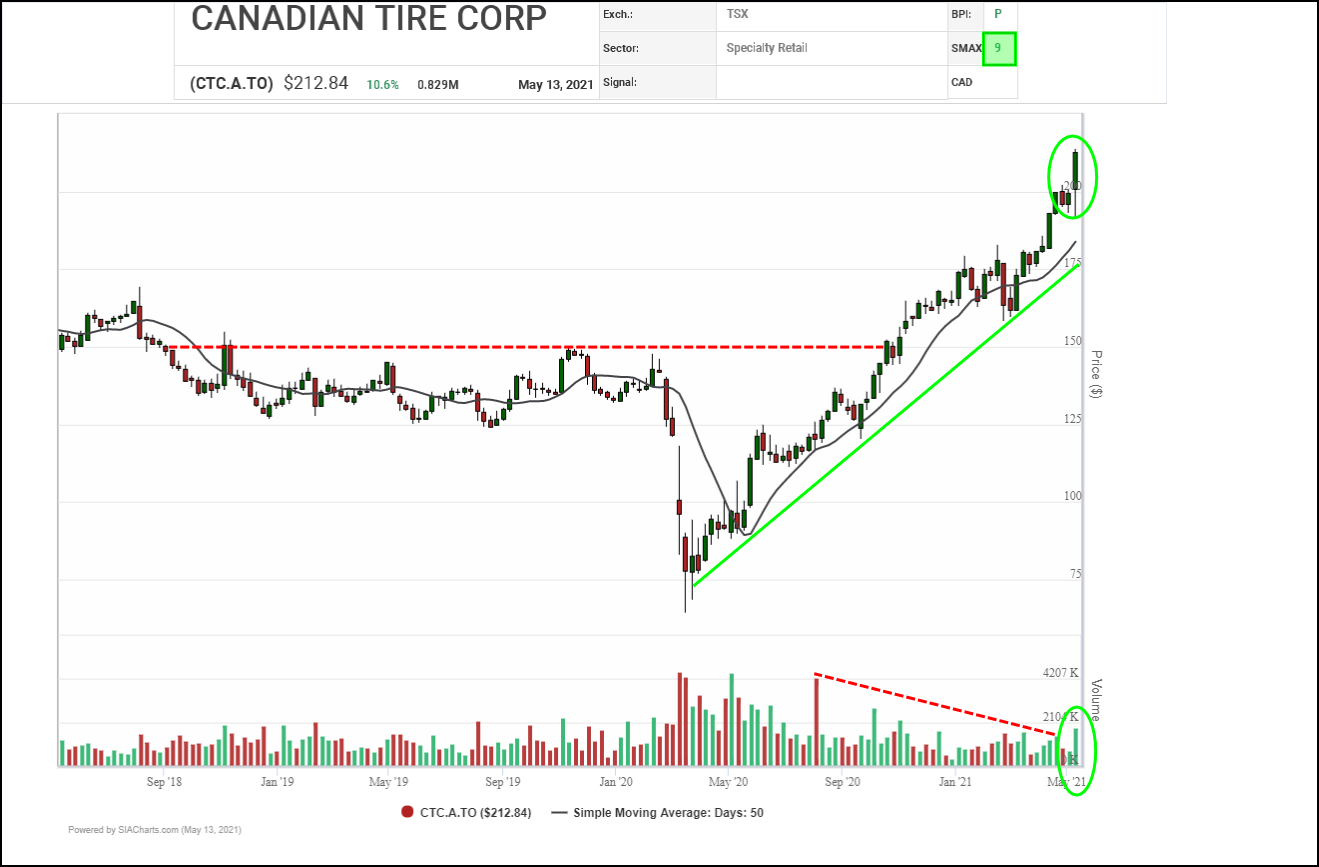
The shares continue to attract new interest. This week, CTC.A.TO has broken out over $200.00 on increased volume. Measured moves suggest next potential upside resistance may appear near $235.00 then $265.00, along with the $250.00 round number. Initial support appears near the $200.00 round number, then $192.00 based on recent daily lows.
*Shares of Canadian Tire are held in portfolios managed by SIA Wealth Management.
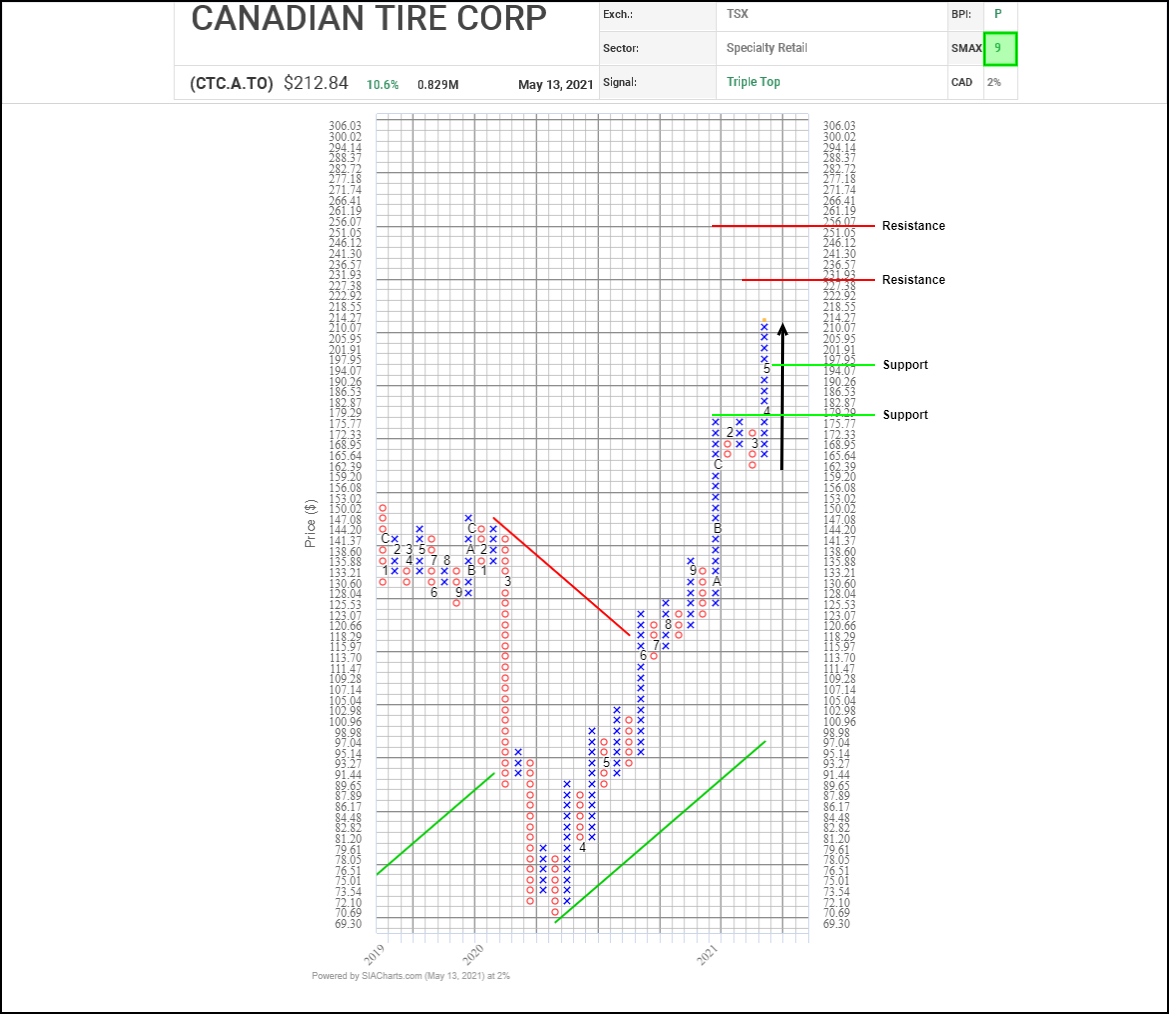
The current upleg in Canadian Tire* (CTC.A.TO) shares which started back in March, and was confirmed back in April with a bullish Triple Top breakout, has continued into May with the shares continuing to climb to new all-time highs and breaking out over $200.00.
Next potential upside resistance tests appear near $232.00 then $256.10 based on horizontal and vertical counts, along with the $250.00 round number. Initial support appears near the $200.00 round number, then $194.05 based on a 3-box reversal.
With a bullish SMAX score of 9, CTC.A.TO is exhibiting near-term strength against the asset classes.
*Shares of Canadian Tire are held in portfolios managed by SIA Wealth Management.
Disclaimer: SIACharts Inc. specifically represents that it does not give investment advice or advocate the purchase or sale of any security or investment whatsoever. This information has been prepared without regard to any particular investors investment objectives, financial situation, and needs. None of the information contained in this document constitutes an offer to sell or the solicitation of an offer to buy any security or other investment or an offer to provide investment services of any kind. As such, advisors and their clients should not act on any recommendation (express or implied) or information in this report without obtaining specific advice in relation to their accounts and should not rely on information herein as the primary basis for their investment decisions. Information contained herein is based on data obtained from recognized statistical services, issuer reports or communications, or other sources, believed to be reliable. SIACharts Inc. nor its third party content providers make any representations or warranties or take any responsibility as to the accuracy or completeness of any recommendation or information contained herein and shall not be liable for any errors, inaccuracies or delays in content, or for any actions taken in reliance thereon. Any statements nonfactual in nature constitute only current opinions, which are subject to change without notice.