
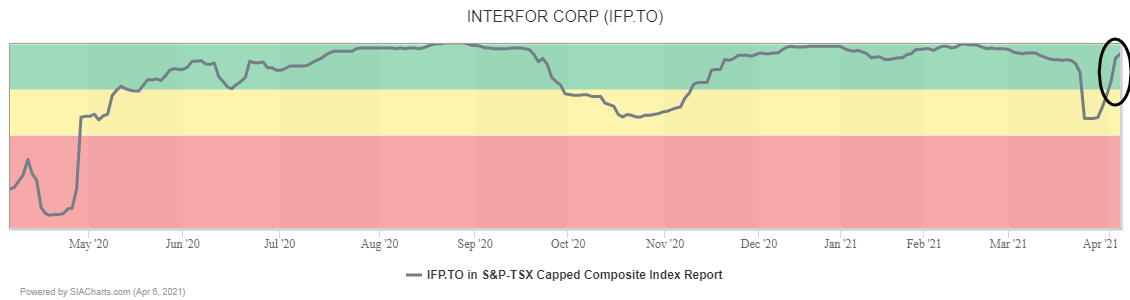
Forest products producer Interfor* (IFP.TO) recently returned to the Green Favored Zone of the SIA S&P/TSX Composite Index Report from a brief dip into the yellow zone. Yesterday the shares moved to 15th place, up 5 spots on the day and up 54 spots over the last month.
Shares broke out to a new high yesterday closing above $30.00. The shares have been under accumulation for over a year now. Last spring they snapped out of a long-term downtrend and have continued to advance. In recent weeks the shares had been consolidating between $22.75 and $30.00, but this stalemate has been resolved by yesterday’s breakout which signals the start of a new advance.
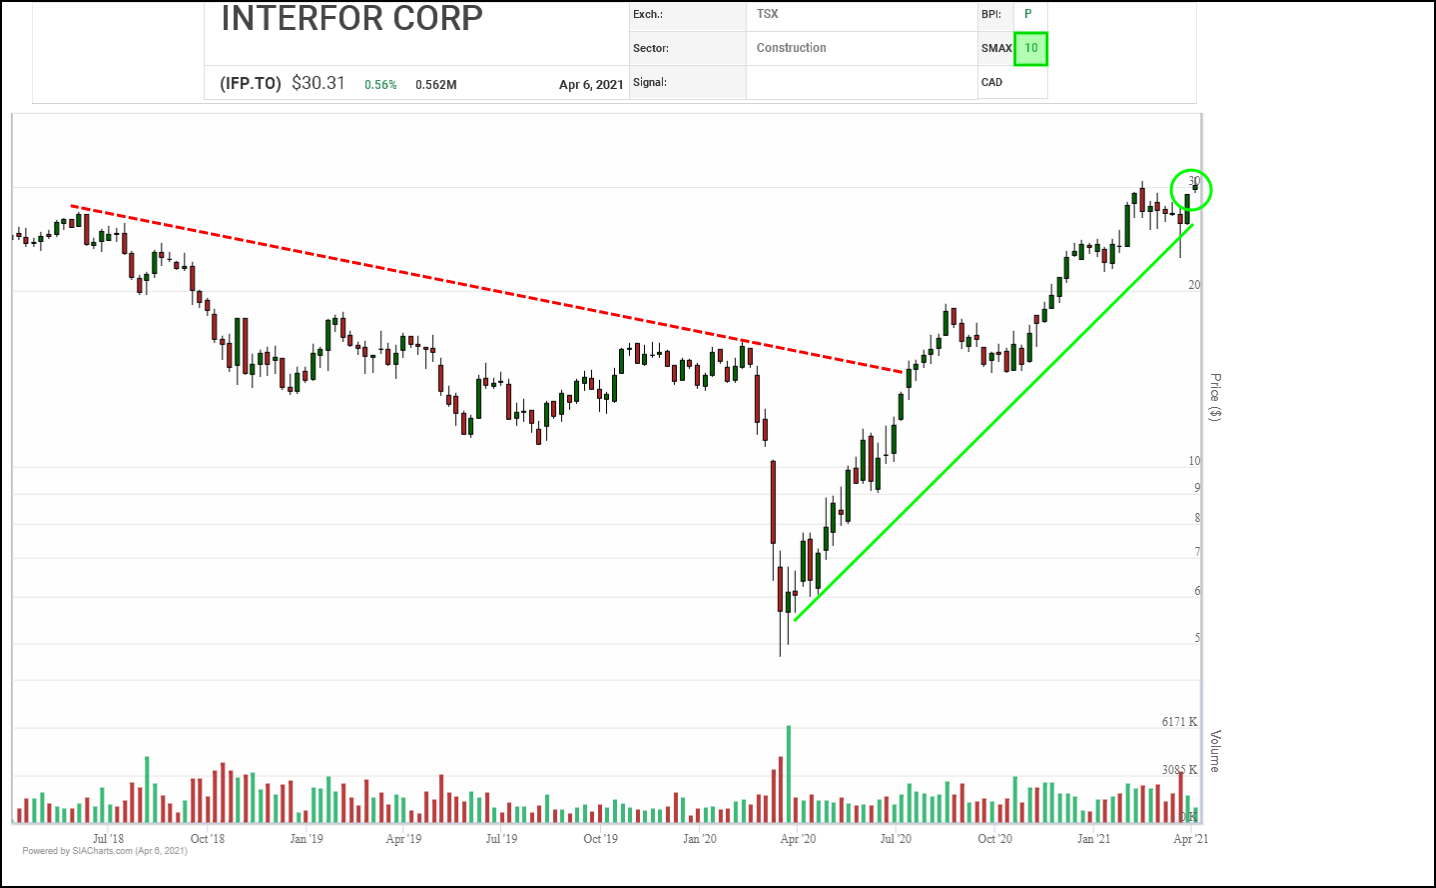
Next potential upside resistance on trend appears near a measured $37.40, followed by the $40.00 round number. Initial support appears near $26.00 where support emerged over the last couple of weeks, then the $25.00 round number.
*Shares of Interfor are held in portfolios managed by SIA Wealth Management.
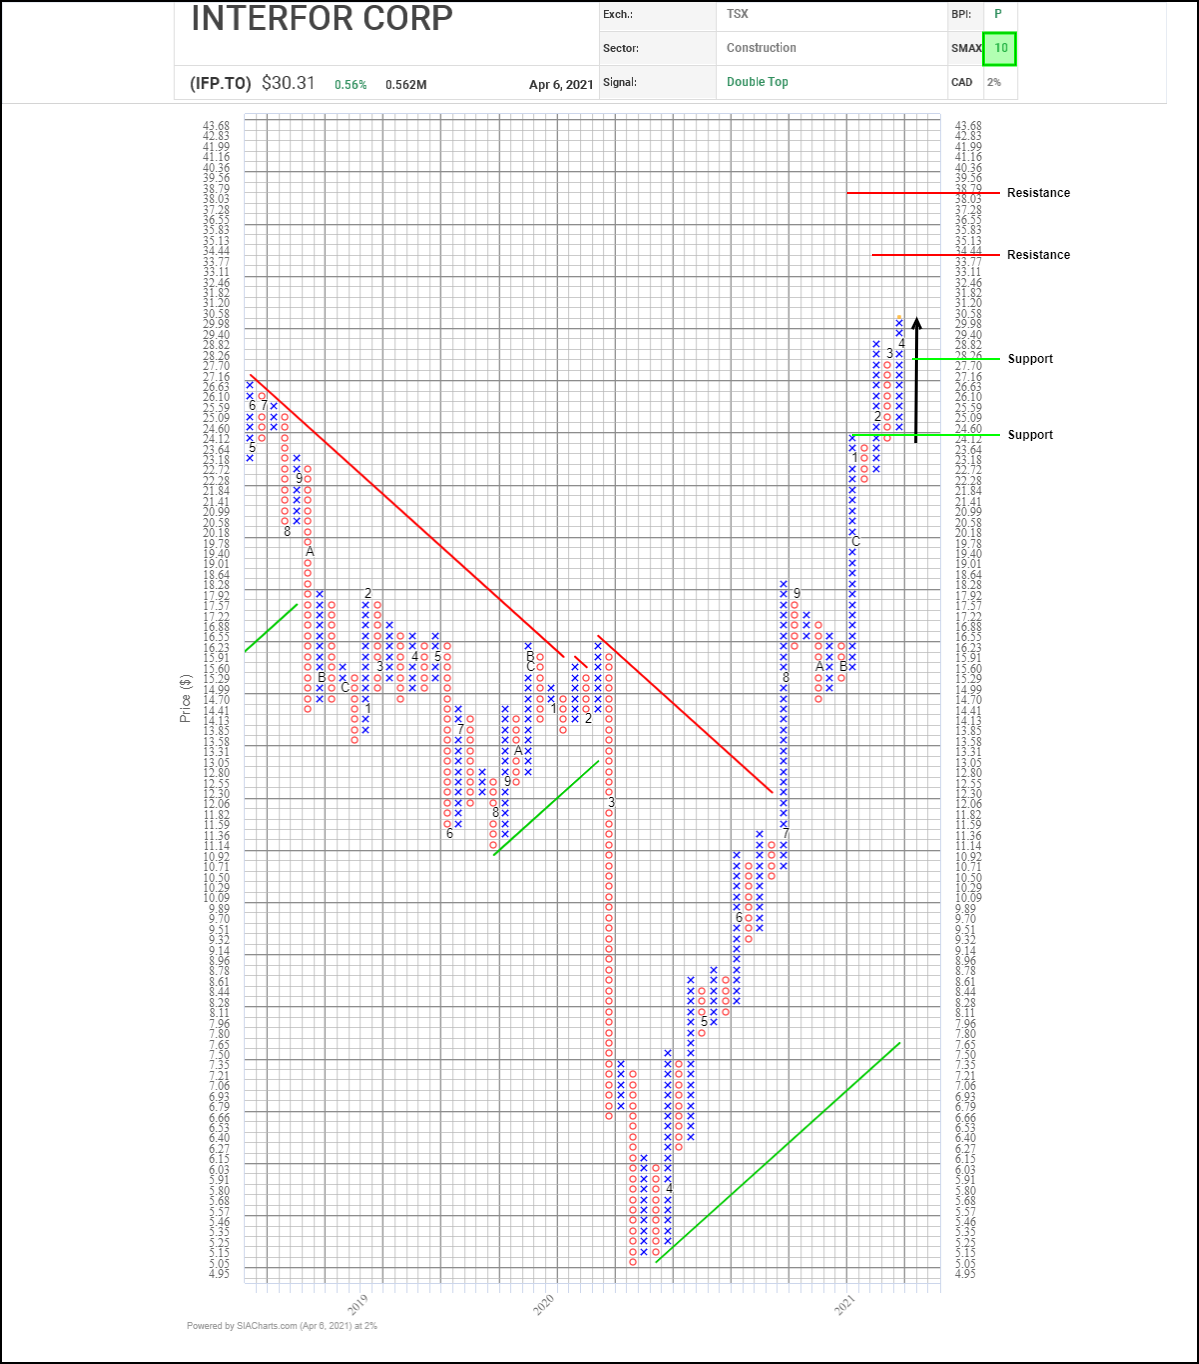
Yesterday’s breakout close above $30.00 for Interfor* (IFP.TO) shares has completed the latest in a series of positive pattern completions, this time a bullish Double Top, signaling the start of a new upleg.
Based on vertical and horizontal counts, next potential upside resistance appears near $34.45 then $38.80 on trend. Initial support appears near $27.70 based on a common 3-box reversal.
With a perfect SMAX score of 10, IFP.TO is exhibiting near-term strength across the asset classes.
*Shares of Interfor are held in portfolios managed by SIA Wealth Management.
Disclaimer: SIACharts Inc. specifically represents that it does not give investment advice or advocate the purchase or sale of any security or investment whatsoever. This information has been prepared without regard to any particular investors investment objectives, financial situation, and needs. None of the information contained in this document constitutes an offer to sell or the solicitation of an offer to buy any security or other investment or an offer to provide investment services of any kind. As such, advisors and their clients should not act on any recommendation (express or implied) or information in this report without obtaining specific advice in relation to their accounts and should not rely on information herein as the primary basis for their investment decisions. Information contained herein is based on data obtained from recognized statistical services, issuer reports or communications, or other sources, believed to be reliable. SIACharts Inc. nor its third party content providers make any representations or warranties or take any responsibility as to the accuracy or completeness of any recommendation or information contained herein and shall not be liable for any errors, inaccuracies or delays in content, or for any actions taken in reliance thereon. Any statements nonfactual in nature constitute only current opinions, which are subject to change without notice.