
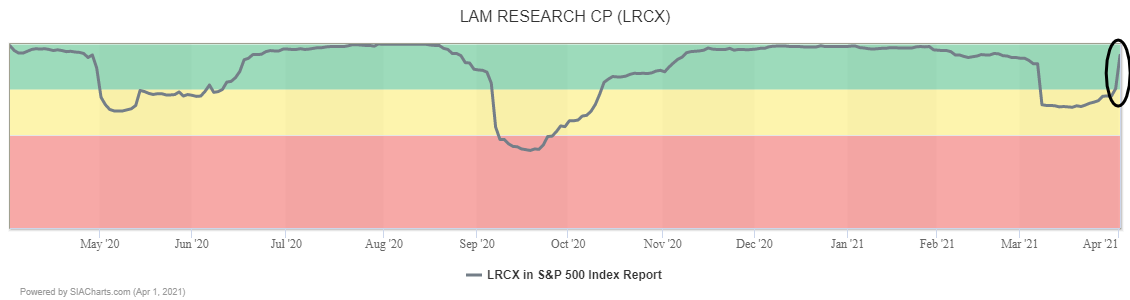
With semiconductor stocks attracting renewed interest last week, Lam Research jumped 91 spots on Thursday, returning to the Green Favored Zone of the SIA S&P 500 Index Report from a brief dip into the yellow zone.
A major breakout is underway in Lam Research shares (LRCX). Last week, the shares gapped upward two days in a row on an uptick in volume, indicating renewed interest. By blasting through $600.00 on Friday, the shares completed a bullish Ascending Triangle pattern ending a consolidation phase and signaling the start of a new advance.
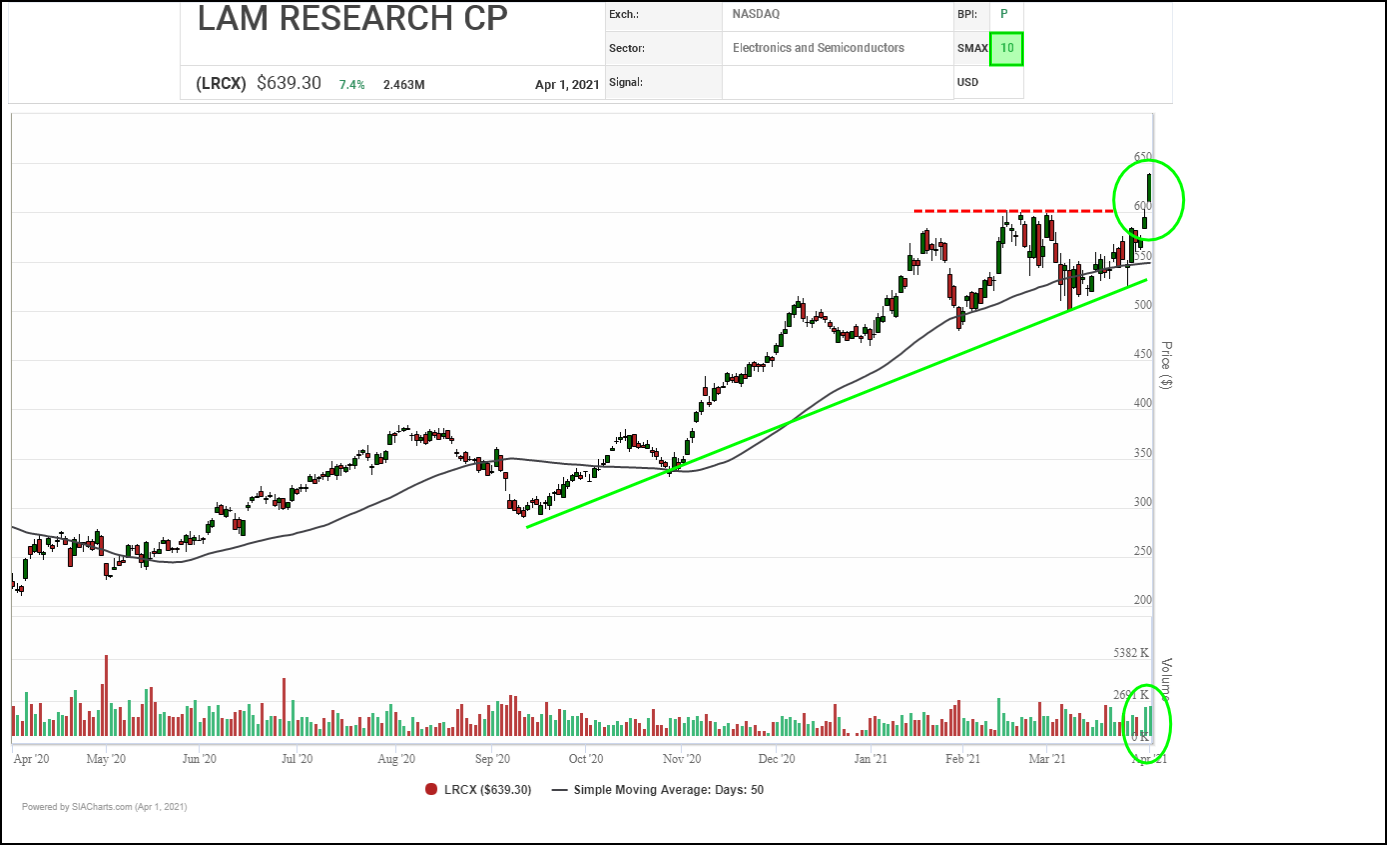
Measured moves from trading ranges within the triangle suggest potential upside resistance tests near $580-$600, then $680-$700 on trend. Initial support appears near $600, where a round number and a retest of the recent breakout point converge.
Lam Research (LRCX) kicked off April by rallying to a new all-time high and completing a bullish Triple Top pattern. This big breakout calls off a previous double bottom, completes a consolidation phase that started back in February, and signals the start of a new upleg within an upward trend which started over a year ago.

Based on horizontal and vertical counts, next potential upside resistance tests on trend appear near $685.00, $726.95 nd $771.40 on trend. Initial support appears near $584.65 based on a 3-box reversal.
With a perfect SMAX score of 10, LRCX is exhibiting near-term strength across the asset classes.
Disclaimer: SIACharts Inc. specifically represents that it does not give investment advice or advocate the purchase or sale of any security or investment whatsoever. This information has been prepared without regard to any particular investors investment objectives, financial situation, and needs. None of the information contained in this document constitutes an offer to sell or the solicitation of an offer to buy any security or other investment or an offer to provide investment services of any kind. As such, advisors and their clients should not act on any recommendation (express or implied) or information in this report without obtaining specific advice in relation to their accounts and should not rely on information herein as the primary basis for their investment decisions. Information contained herein is based on data obtained from recognized statistical services, issuer reports or communications, or other sources, believed to be reliable. SIACharts Inc. nor its third party content providers make any representations or warranties or take any responsibility as to the accuracy or completeness of any recommendation or information contained herein and shall not be liable for any errors, inaccuracies or delays in content, or for any actions taken in reliance thereon. Any statements nonfactual in nature constitute only current opinions, which are subject to change without notice.