by Don Vialoux, EquityClock.com
Technical Notes for Thursday March 4th
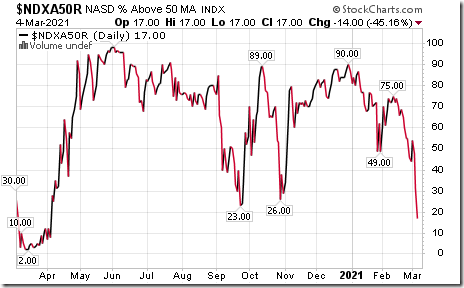
Technicals for NASDAQ 100 stocks continue to deteriorate (as indicated in many of the charts below). The Index has dropped more than 10% from its high on February 16th.Momentum indicators already are deeply oversold. Percent of stocks trading above their 20 day moving average plunged yesterday to 8.00 where an intermediate bottom frequently is reached. Percent of stocks trading above their 50 day moving average plunged to 17.00. However, both momentum indicators have yet to show signs of bottoming.
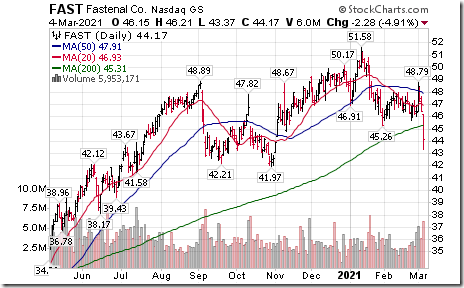
Fastenal ((FAST), a NASDAQ 100 stock moved below $45.26 completing a double top pattern.
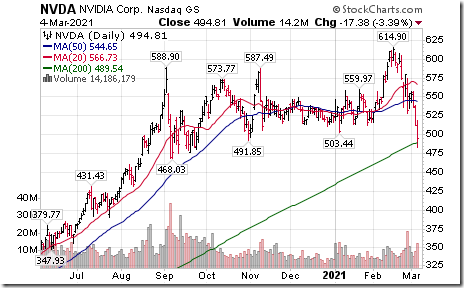
Nvidia (NVDA), a NASDAQ 100 stock moved below $503.44 and $491.05 setting an intermediate downtrend.
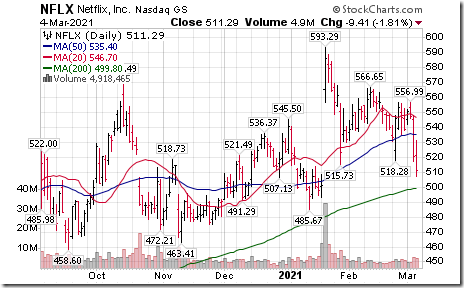
Netflix (NFLX), a NASDAQ 100 stock moved below $515.73 completing a double top pattern.
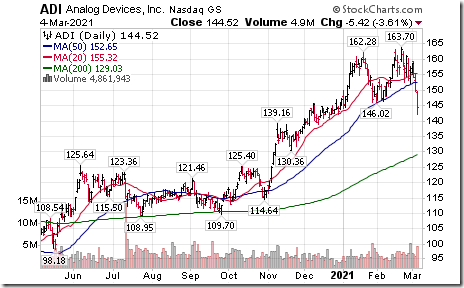
Analog Devices (ADI), a NASDAQ 100 stock moved below $146.02 completing a double top pattern.
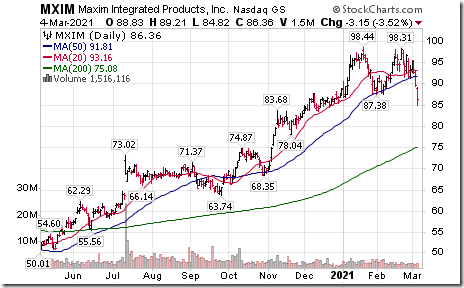
Maxim Integrated (MXIM), a NASDAQ 100 stock moved below $87.38 completing a double top pattern.
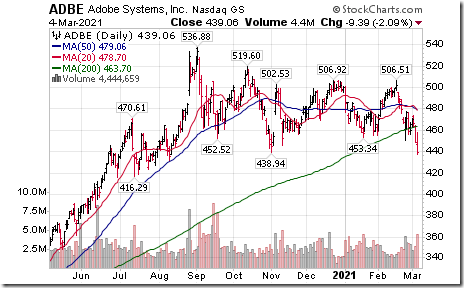
Adobe (ADBE), a NASDAQ 100 stock moved below $439.94 setting an intermediate downtrend.
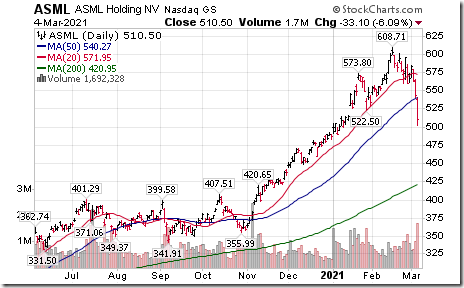
ASML Holdings (ASML), a NASDAQ 100 stock moved below intermediate support at $522.50.
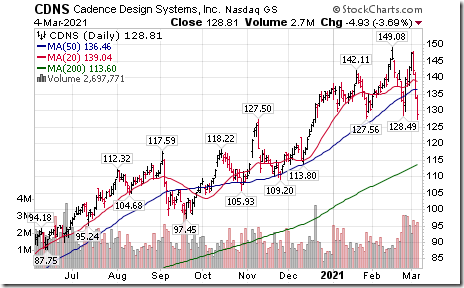
Cadence Design Systems (CDNS), a NASDAQ 100 stock moved below $128.49 and $127.56 completing a Head & Shoulders pattern.
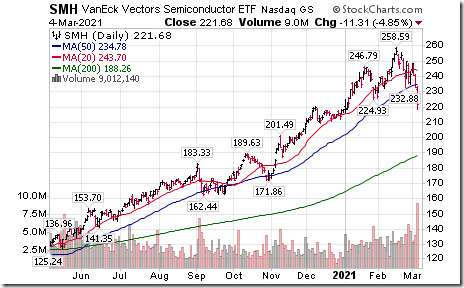
Semi-conductor ETF (SMH) moved below intermediate support at $224.93. Semi-conductor iShares (SOXX) also broke intermediate support with a similar technical pattern.
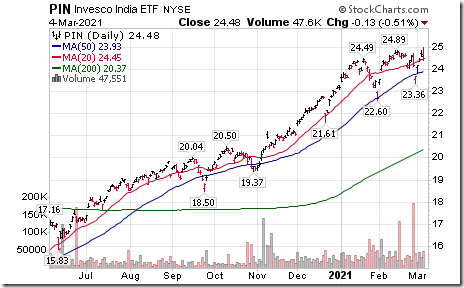
India ETF (PIN) moved above $24.89 to an all-time high extending an intermediate uptrend.
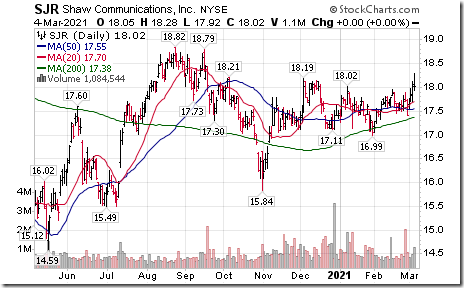
Shaw Communications (SJR), a TSX 60 stock moved above US$18.19 resuming an intermediate uptrend.
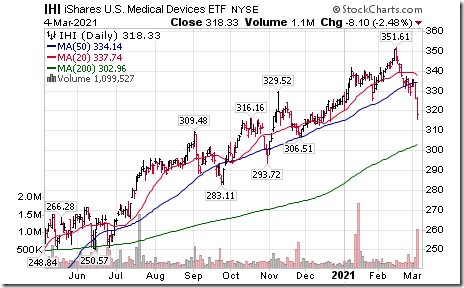
Medical Devices iShares (IHI) moved below intermediate support at $325.11
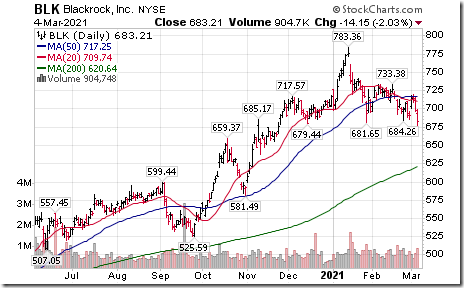
Blackrock (BLK), an S&P 100 stock moved below $681.65 completing a double top pattern.
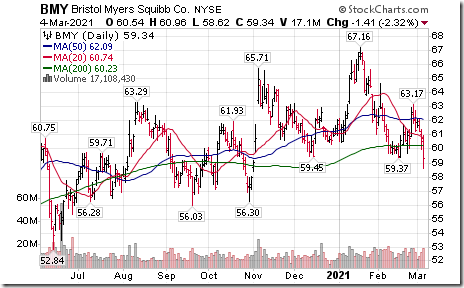
Bristol-Myers Squibb (BMY), an S&P 100 stock moved below $59.37 completing a Head & Shoulders pattern.
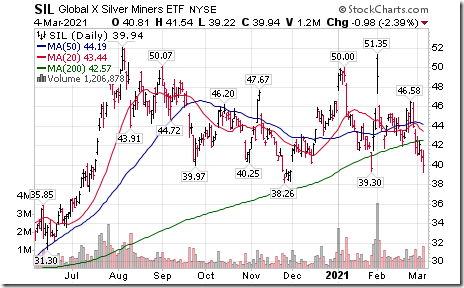
Silver Miners ETF (SIL) moved below $39.30 setting an intermediate downtrend.
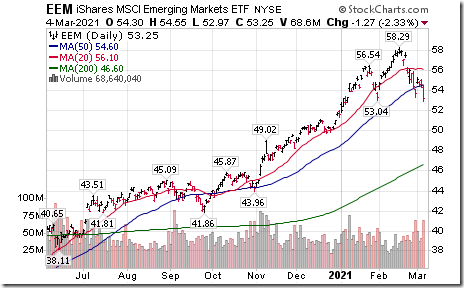
Emerging Markets iShares (EEM) moved below intermediate support at $53.04.
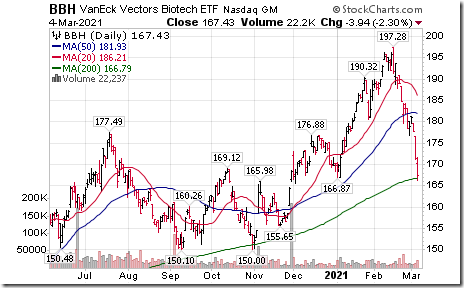
Biotech ETF (BBH) moved below intermediate support at $166.87.
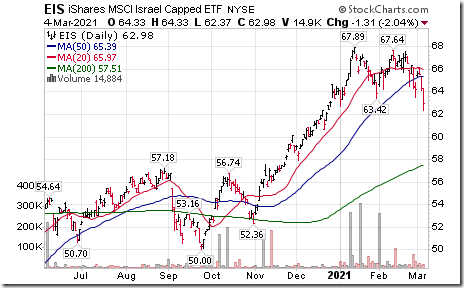
Israel iShares (EIS) moved below $63.42 completing a double top pattern.
A different look at Climate Change
National climate emergency? Look at the science! Here is the link:
https://www.youtube.com/watch?v=CA1zUW4uOSw
Trader’s Corner
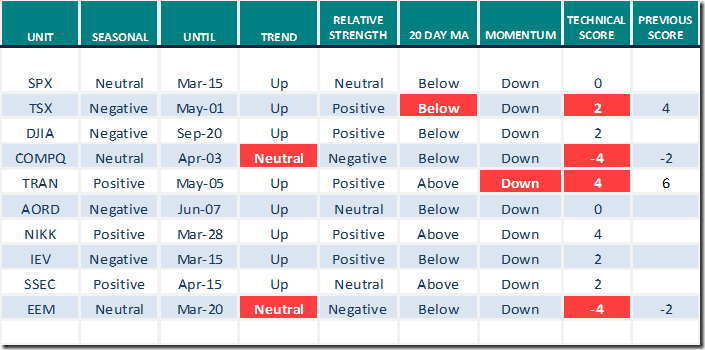
Equity Indices and Related ETFs
Daily Seasonal/Technical Equity Trends for March 4th 2021
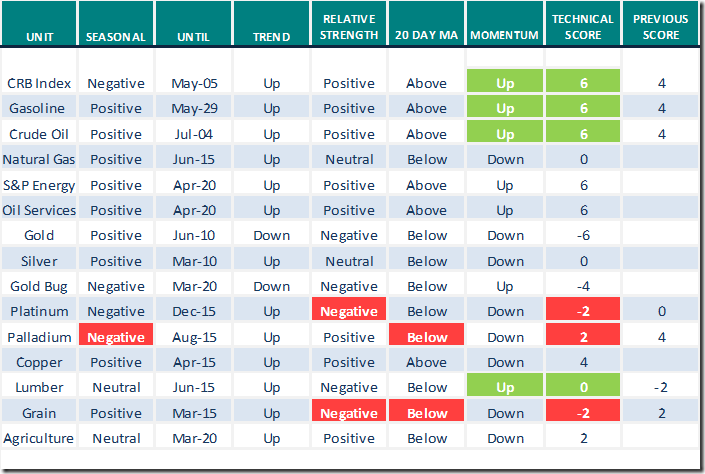
Green: Increase from previous day
Red: Decrease from previous day
Commodities
Daily Seasonal/Technical Commodities Trends for March 4th 2021
Green: Increase from previous day
Red: Decrease from previous day
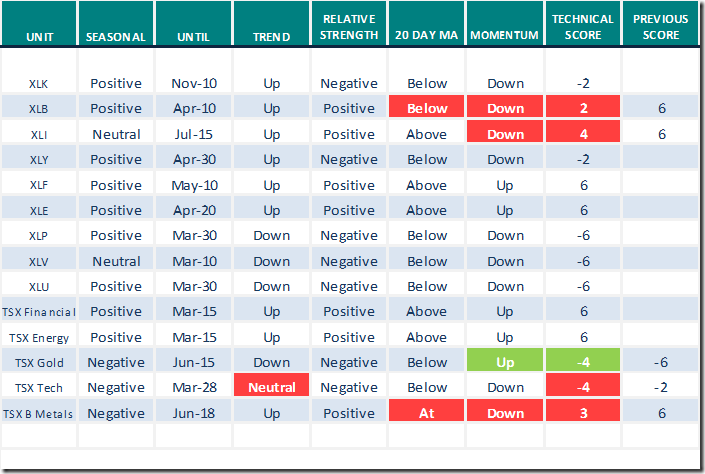
Sectors
Daily Seasonal/Technical Sector Trends for March 4th 2021
Green: Increase from previous day
Red: Decrease from previous day
Changes in Seasonality Ratings relative to the S&P 500 Index
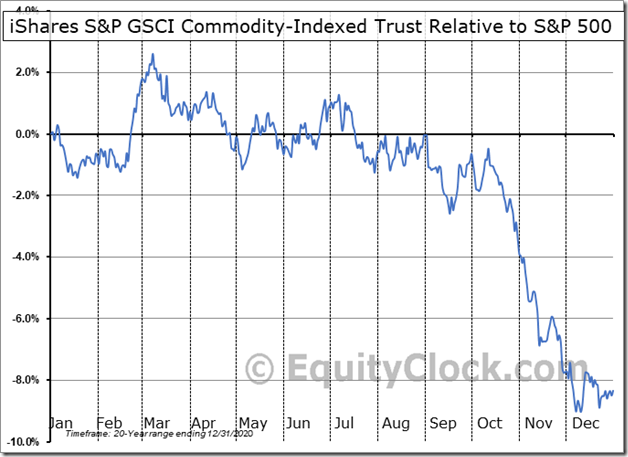
CRB Index from Positive to Negative to May 5th
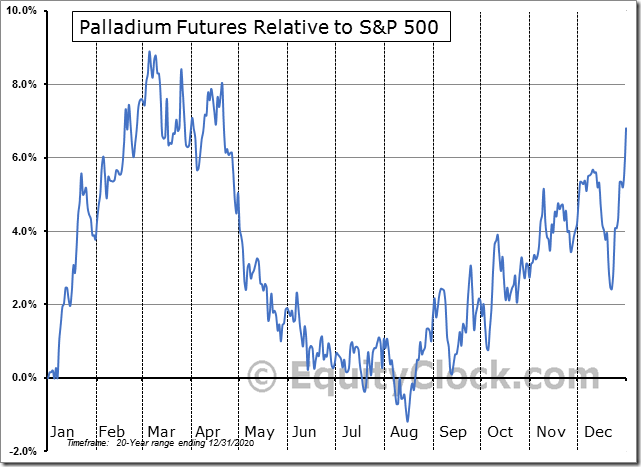
Palladium: Positive to Negative to August 15th
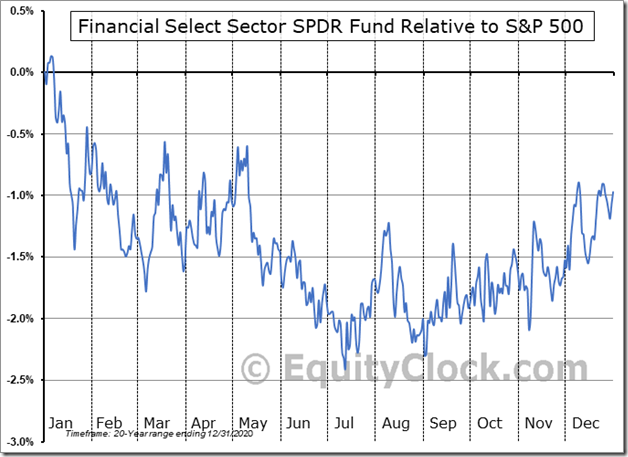
U.S. Financials: Negative to Positive to May10th
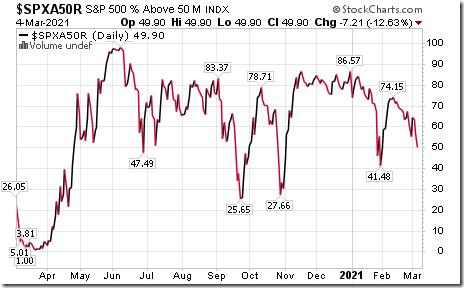
S&P 500 Momentum Barometer
The intermediate Barometer plunged 7.21 to 49.90 yesterday. It remains Neutral and trending down.
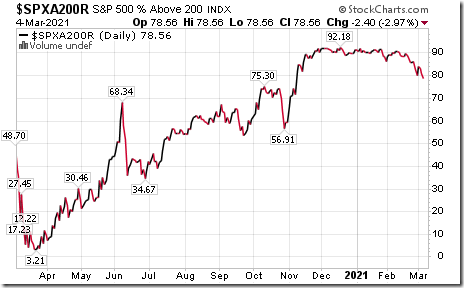
The long term Barometer dropped 2.40 to 78.56 yesterday. It changed from Extremely Overbought to Overbought on a drop below 80.00 and is trending down.
TSX Momentum Barometer
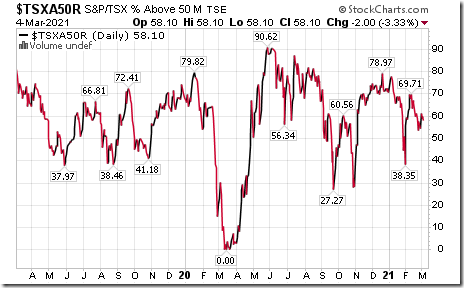
The intermediate Barometer slipped 2.00 to 58.10 yesterday. It changed from Overbought to Neutral on a drop below 60.00.
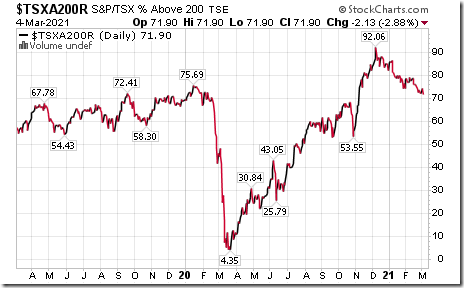
The long term Barometer eased 2.13 to 71.90 yesterday. It remains Overbought and trending down.
Disclaimer: Seasonality and technical ratings offered in this report and at
www.equityclock.com are for information only. They should not be considered as advice to purchase or to sell mentioned securities. Data offered in this report is believed to be accurate, but is not guaranteed
This post was originally publised at Vialoux's Tech Talk.


![clip_image010[1] clip_image010[1]](https://advisoranalyst.com/wp-content/uploads/2021/03/clip_image0101_thumb.png)
