
by Brian Levitt, Portfolio Manager, Invesco Canada
With the Biden administration acknowledging plans to potentially raise taxes, could the bull market be in jeopardy?
The U.S. federal budget deficit is widening, and the Biden administration is proposing tax increases in the U.S. What might this mean for markets? As this article explains, history shows us that the U.S. equity market has generally performed well in different tax regimes.
The problem
The U.S. federal government has already committed over $3 trillion USD in spending to support the economy during the coronavirus pandemic, and President Joe Biden’s administration is currently seeking an additional $1.9 trillion USD in spending.1
At the same time, the federal government has been collecting less revenue as a result of the weakness in economy activity. The upshot is a substantial widening of the U.S. federal budget deficit.
Spending is outpacing revenue by a wide margin
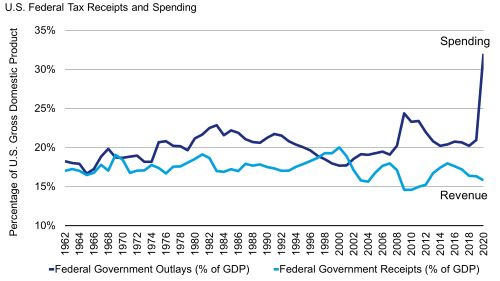
Sources: Federal Reserve Bank of St. Louis, Dec. 31, 2020
The proposal
The Biden administration is proposing tax increases designed to generate revenue and to reduce the income gap between the nation’s higher and lower earners. The proposed changes to the tax code2 include:
- Increasing the corporate tax rate from 21% to approximately 25% to 28%, likely starting in 2022, and establishing a corporate alternative minimum tax
- Restoring the top marginal tax rate from 37% to 39.6% for taxpayers earning over $400,000 USD of annual income and lowering the value of income tax deductions
- Increasing the capital gains tax rate to approximately 25% to 28% for households earning over $1 million USD per year
Historical perspective
Biden’s tax proposals would be large from a historical perspective. It is estimated the tax plan would increase federal revenue by over $140 billion USD in 2021, over $300 USD billion in 2022, and by a total of $3.1 trillion USD from 2021 to 2030.1
While the expected revenue effect from the tax increases is likely to be large, it is important to note that a 28% corporate tax rate would be lower than rates during past decades. For example, the top corporate tax rate was at or near 35% in the 1990s, 2000s and 2010s; was more than 40% in the 1960s and 1970s; and was more than 50% in the 1950s and 1960s.3
Equity performance
There is little in the historical data to suggest that the U.S. equity market has been primarily driven by changes in the tax code.3
- In the 1940s and 1950s, U.S. equities performed well even as tax rates were rising.
- In the 1970s, equities posted below-average returns even as tax rates were declining, as the market was being driven by inflation concerns.
- Equities performed well in the 1980s and 1990s amid lower taxes but underperformed in the 2000s in the aftermath of the Bush tax cuts, the result of the tech bubble, and the global financial crisis. In the 2010s, markets surged from the depths of the global financial crisis, even as individual tax rates were increased.
We would caution against drawing any hard conclusions on this analysis. There are often many other factors at play, including, but not limited to, the stage of the economic cycle and the direction of monetary policy.
Investors, at a minimum, may take solace in the below chart indicating that markets have generally performed well in different tax regimes.
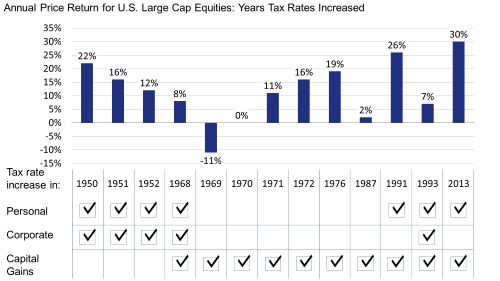
Sources: Shiller, Yale database, Dec. 31, 2020. U.S. Large Cap Equities represented by the Shiller US Large Cap Index. The Shiller US Large Cap Index is an index created by Robert Shiller that measures the stock performance of U.S. large cap stocks. An investment cannot be made directly in an index. Past performance does not guarantee future results.
Conclusion
Historically the U.S. stock market has largely performed well even in the years in which taxes — be they personal, corporate, or capital gains — were increased. Most recently, the U.S. stock market surged 30% in 2013 despite the Obama administration allowing the Bush-era tax cuts to expire at the end of the year (as shown in the chart above). In fact, U.S. equities advanced by 100% from the time of the expiration of the Bush-era tax cuts to the Trump administration’s passing of the Tax Cuts and Jobs Act of 2017.4
For further analysis about the impact of taxes — including the capital gains tax and the income tax — explore our chartbook .
1 Source: Congressional Budget Office, 12/31/20
2 Source: Strategas Research Partners, 12/31/20
3 Sources: US Department of Treasury, Shiller, Yale database, Dec. 31, 2020.
4 Source: Bloomberg, L.P. Based on the S&P 500 Index.
This post was first published at the official blog of Invesco Canada.