


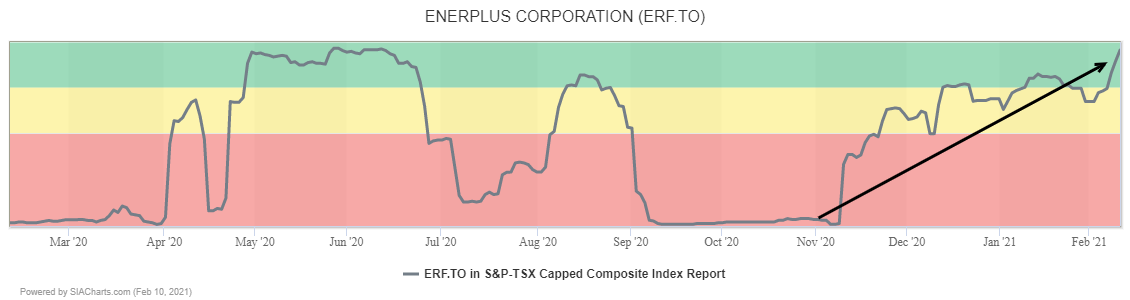
Since November, Enerplus (ERF.TO) has been steadily climbing up the rankings in the SIA S&P/TSX Composite Index Report, rising from deep in the red zone and returning to the Green Favored Zone this week. The shares have climbed 49 spots in the last week including 13 yesterday to 12th place.
A major breakout is underway in Enerplus (ERF.TO) shares. Since May, the shares have been base building in a sideways range between $2.25 and $5.00. Starting in October, the shares have been climbing within this range, forming a bullish Ascending Triangle pattern. Last month, the shares snapped out of a downtrend and this week, the shares have completed the base with a breakout over $5.00 on volume.
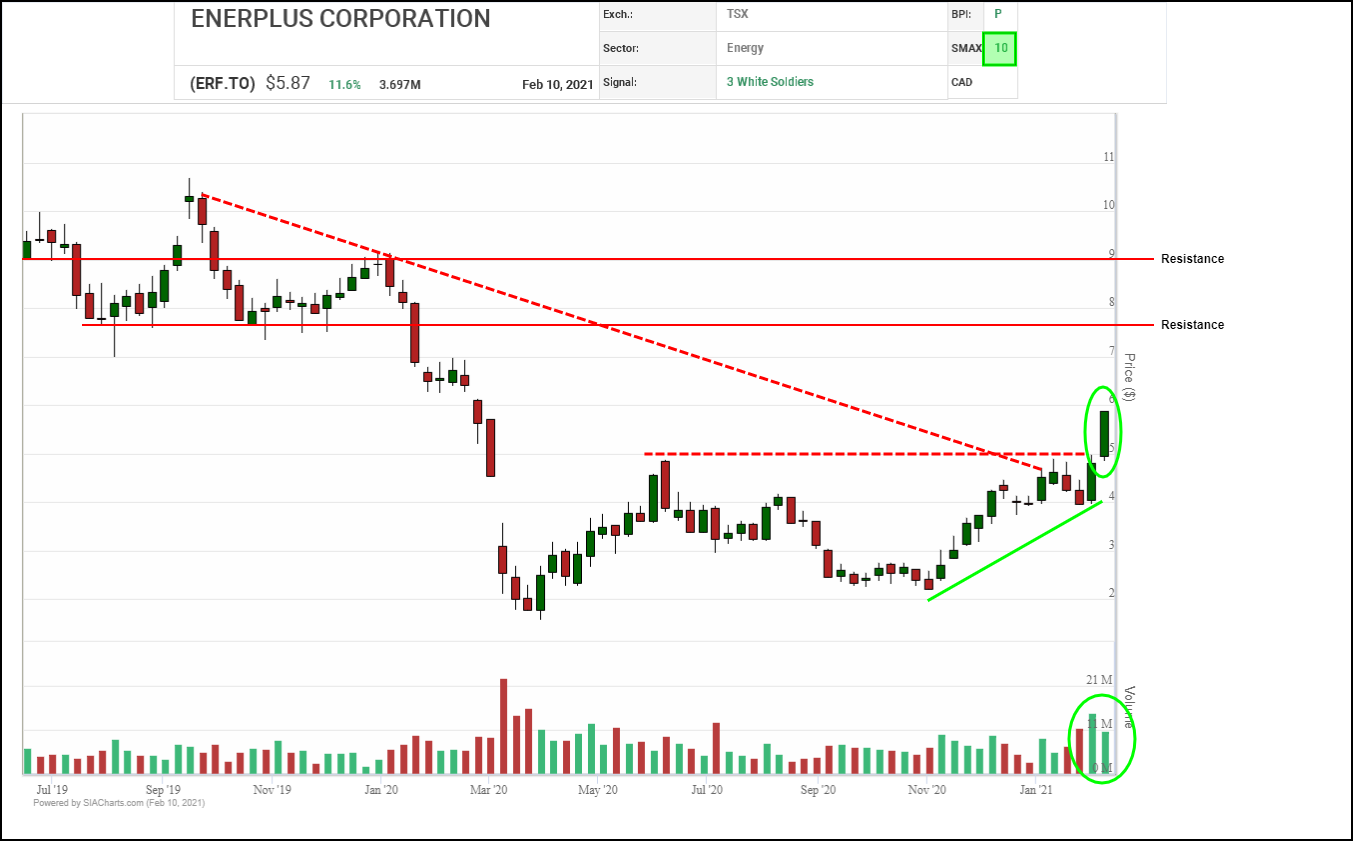
Initial upside resistance appears near $7.75 where a measured move from the triangle converges with a previous breakdown point, followed by established resistance at previous highs near $9.00. Initial support moves up to the $5.00 breakout point from $4.00.
Enerplus (ERF.TO) shares have been under renewed accumulation since October, completing a series of bullish Double Top pattern breakouts and establishing an uptrend of higher lows. In recent weeks, bullish signals have continued to roll in with the shares breaking through their June peak, snapping a downtrend line, regaining $5.00 and advancing on $6.00.
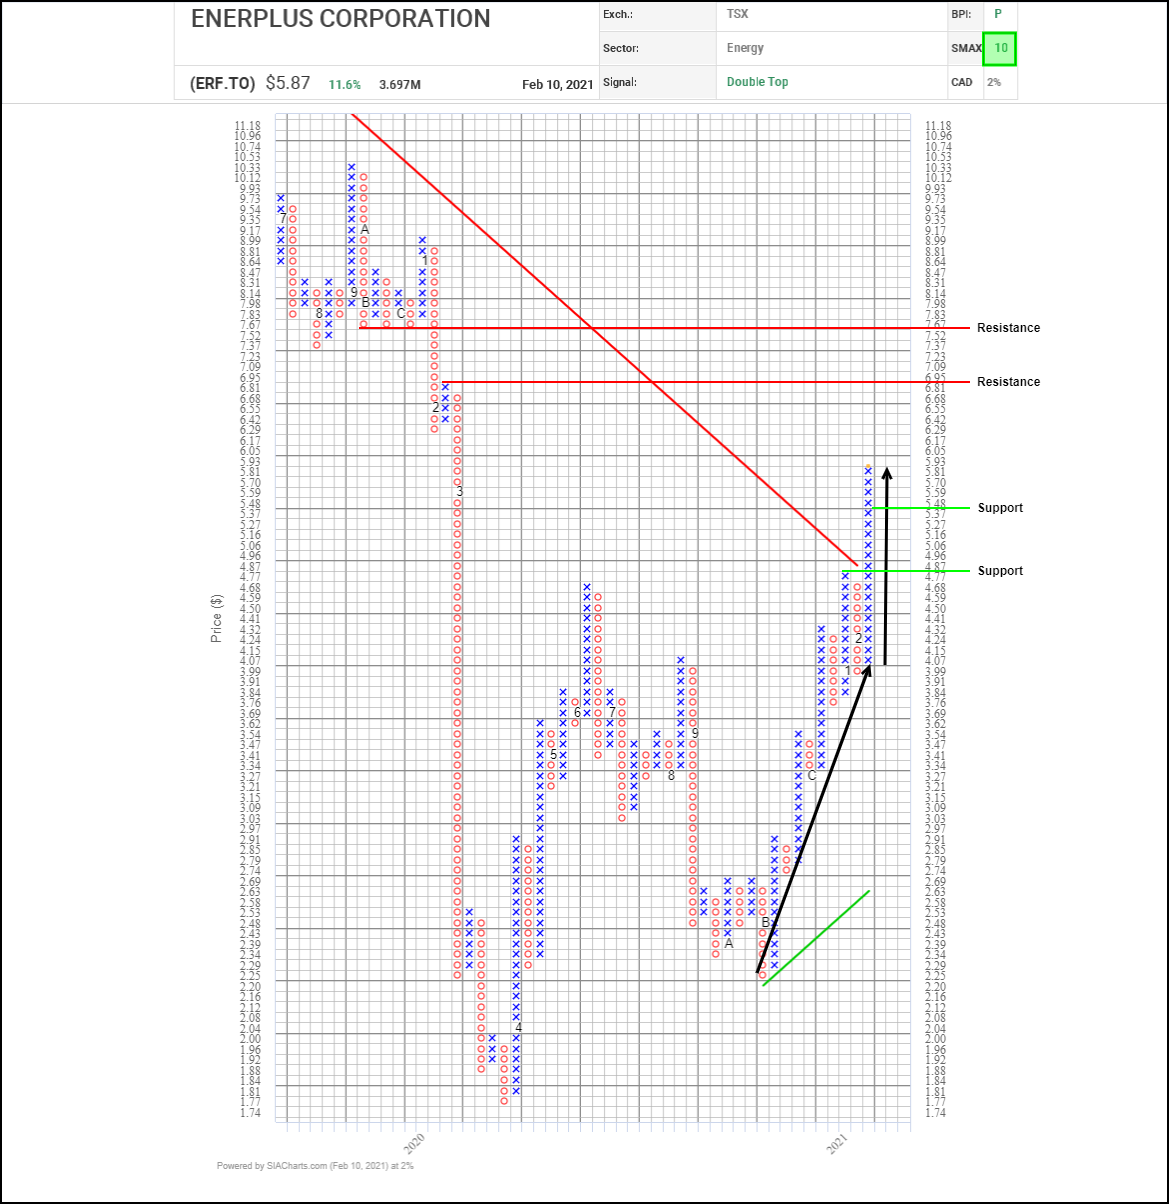
Next potential upside resistance appears near $6.95 where a previous column high converges with a horizontal count, followed by $7.65, where a vertical count coincides with previous column lows. Initial support appears near $5.35 based on a 3-box reversal.
With a perfect SMAX score of 10, ERF.TO is exhibiting near-term strength across the asset classes.
Disclaimer: SIACharts Inc. specifically represents that it does not give investment advice or advocate the purchase or sale of any security or investment whatsoever. This information has been prepared without regard to any particular investors investment objectives, financial situation, and needs. None of the information contained in this document constitutes an offer to sell or the solicitation of an offer to buy any security or other investment or an offer to provide investment services of any kind. As such, advisors and their clients should not act on any recommendation (express or implied) or information in this report without obtaining specific advice in relation to their accounts and should not rely on information herein as the primary basis for their investment decisions. Information contained herein is based on data obtained from recognized statistical services, issuer reports or communications, or other sources, believed to be reliable. SIACharts Inc. nor its third party content providers make any representations or warranties or take any responsibility as to the accuracy or completeness of any recommendation or information contained herein and shall not be liable for any errors, inaccuracies or delays in content, or for any actions taken in reliance thereon. Any statements nonfactual in nature constitute only current opinions, which are subject to change without notice.