by Don Vialoux, EquityClock.com
The Bottom Line
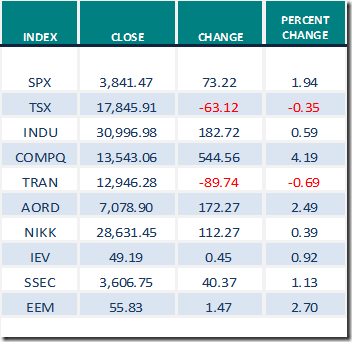
U.S. equity indices were mixed, the TSX Index was slightly lower and Far East indices continued moving higher last week. Greatest influences on North American equity markets remain growing evidence of a second wave of the coronavirus (negative) and timing of distribution of a vaccine (positive).
Observations
The Dow Jones Industrial Average and S&P 500 Index followed their historic trend during a U.S. Presidential Election period. The strongest 12 week period during the four year U.S. Presidential Cycle has occurred from U.S. Presidential Election Day to Inauguration Day on January 20th. From Election Day last year to January 20th this year, the Dow Jones Industrial Average advanced 14.3%, the S&P 500 Index gained 13.5%.and the TSX Composite Index increased.13.0%. Short term technical evidence by U.S. equity indices (Stochastics, MACD, RSI) suggest that the U.S. Presidential Election trade ended on schedule on or about January 20th. 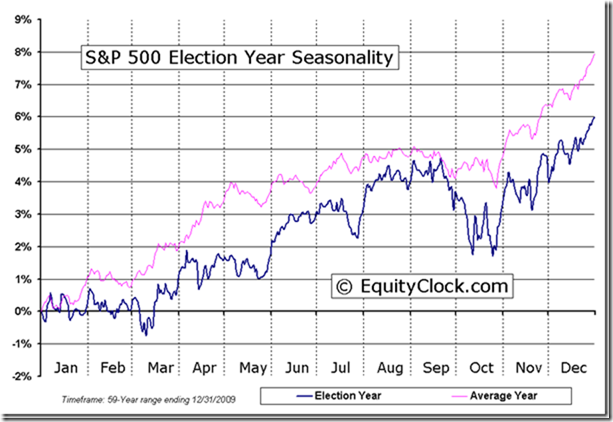
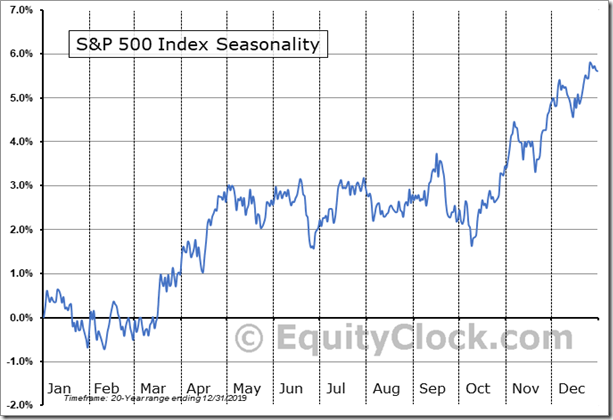
“Santa Claus Hangover” period has arrived. On average, the S&P 500 Index during the past 20 periods from January 8th to February 14th dropped 1.5% per period: All of the gains recorded during the Santa Claus Rally period from December 14th to January 8th were lost during the Santa Claus Hangover period. This is the time of year when U.S. consumers and investors are paying down debts accrued during the Santa Claus Rally period.
What about this year? Excluding performance by FAANG + Microsoft stocks, the S&P 500 Index is following its historic pattern this year. The Index based on the remaining 494 stocks moved slightly lower last week (FAANG stands for Facebook, Amazon, Apple, Netflix and Google). Average (median) gain by these six stocks last week was 8.99%. They represent a 24% weight in the S&P 500 Index. Their gain added approximately 2.15% to the S&P 500 Index versus an actual gain of 1.94% last week. The remaining 494 stocks slipped 0.21% last week. Strength by FAANG +MSFT stocks was triggered by an unexpected strong quarterly revenue report released by Netflix that saw the stock break to an all-time high and record a gain of 13.5% last week.
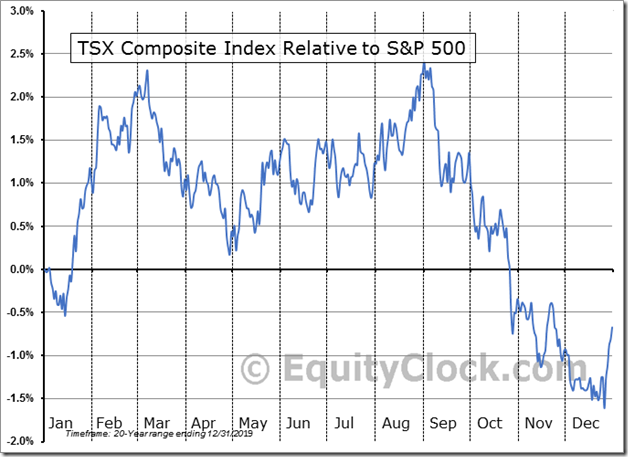
Note that the “Santa Claus Hangover” normally does not happen in the Canadian equity market. The main reason: Canadian investors focus on contributing to their RRSPs during the first 60 days in the New Year and subsequently invest more funds into the equity market. Strongest period in the year for the TSX Composite Index relative to the S&P 500 Index is from mid-December to the first week in March. As indicated in the chart below, average gain per period for the TSX Composite Index relative to the S&P 500 Index during the past 20 periods was 3.3%. Performance of the TSX Composite Index relative to the S&P 500 Index since December 30th provides evidence that history is repeating during the current period.
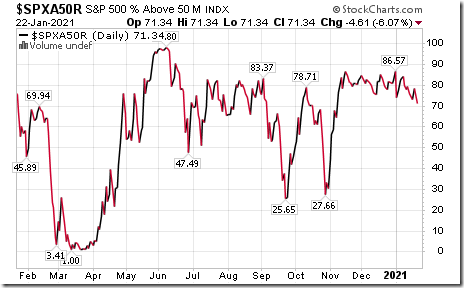
Medium technical indicator for U.S. equity markets (e.g. Percent of S&P 500 stocks trading above their 50 day moving average) moved lower again last week and is trending down. See Barometer chart at the end of this report.
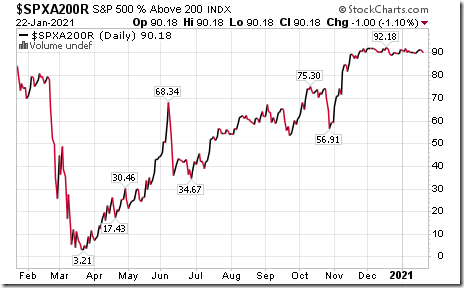
Long term technical indicator for U.S. equity markets (e.g. Percent of S&P 500 stocks trading above their 200 day moving average).was virtually unchanged again last week at extremely overbought levels. See chart at the end of this report.
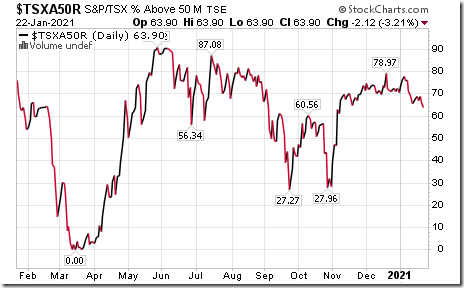
Medium term technical indicator for Canadian equity markets moved lower again last week. It remained intermediate overbought and trending down. See Barometer chart at the end of this report.
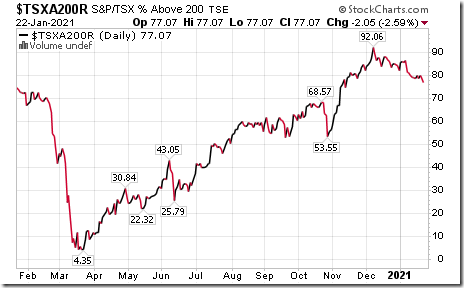
Long term technical indicators for Canadian equity markets (i.e. Percent of TSX stocks trading above their 200 day moving average) also moved lower again last week. It remains intermediate overbought and trending down. See Barometer chart at the end of this report.
Short term short term momentum indicators for U.S. equity indices (20 day moving averages, short term momentum indicators) moved higher last week thanks to the FAANG + MSFT stocks. Indicators for commodities and sectors (with the notable exception of the Technology sector) moved slightly lower.
Short term momentum indicators for Canadian indices and sectors were mixed last week.
Year-over-year 2020 consensus earnings declines by S&P 500 companies ebbed again last week. According to www.FactSet.com, fourth quarter earnings are expected to drop 4.7% on a year-over-year basis (versus previous decline of 6.8% last week) and revenues are expected to increase 0.7% (versus previous 0.3% increase). Earnings for all of 2020 are expected to fall 12.3% (versus previous 12.9% decline) and revenues are expected to decline 1.5% (versus previous 1.7% decline).
Consensus estimates for earnings and revenues by S&P 500 companies turn positive on a year-over-year basis in the first quarter of 2021. According to www.FactSet.com earnings in the first quarter of 2021 on a year-over-year basis are expected to increase 18.1% (versus previous 16.8% increase last week) and revenues are expected to increase 3.9% (versus previous 3.9%). Earnings in the second quarter are expected to increase 47.8 % (versus previous 46.3% increase) and revenues are expected to increase 14.8% (versus previous 14.2% increase). Earnings in the third quarter are expected to increase 15.3% and revenues are expected to increase 8.7%. Earnings in the fourth quarter are expected to increase 18.1% and revenues are expected to increase 7.3%. Earnings for all of 2021 are expected to increase 22.7% (versus previous 22.5% increase) and revenues are expected to increase 8.3% (versus previous 8.1% increase).
Economic News This Week
December Durable Goods Orders to be released at 8:30 AM EST on Wednesday are expected to increase 1.0% versus a gain of 1.0% in November. Excluding transportation orders, December Durable Goods Orders are expected to increase 0.5% versus a gain of 0.4% in November.
FOMC Decision on the Fed Fund Rate is released at 2:00 PM EST on Wednesday. No change in rate is expected.
Fourth quarter annualized real U.S. GDP to be released at8:30 AM EST on Thursday is expected to increase 3.9% versus a gain of 33.4% in the third quarter.
December New Home Sales to be released at 10:00 AM EST on Thursday are expected to increase to 855,000 from 841,000 in November.
December Leading Economic Index to be released at 10:00 AM EST on Thursday is expected to increase 0.5% versus a gain of 0.6% in November.
December Personal Income to be released at 8:30 AM EST on Friday is expected to increase 0.1% versus a decline of 1.1% in November. December Personal Spending is expected to slip 0.4% versus a decline of 0.4% in November.
Canadian November GDP to be released at 8:30 AM EST on Friday is expected to increase 0.3% versus a gain of 0.4% in October.
January Chicago Purchasing Manager Index to be released at 9:45 AM EST on Friday is expected to slip to 58.0 from 58.7 in December.
January Michigan Consumer Sentiment to be released at 10:00 AM EST on Friday is expected to remain unchanged from December at 79.2.
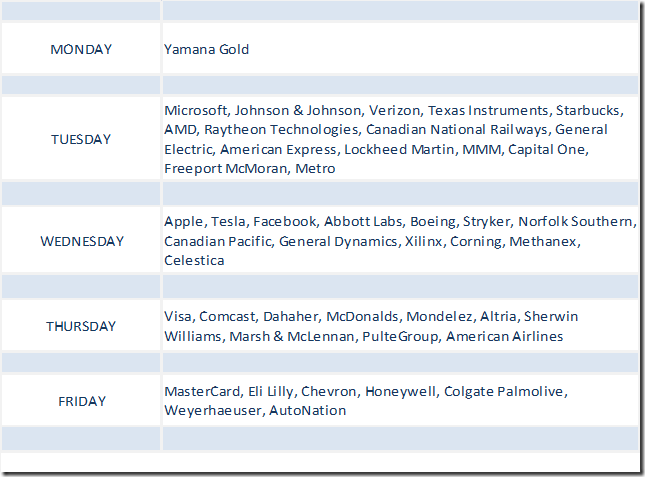
Selected Earnings News This Week
Thirteen percent of S&P 500 companies have reported quarterly results to date.
Trader’s Corner
Equity Indices and Related ETFs
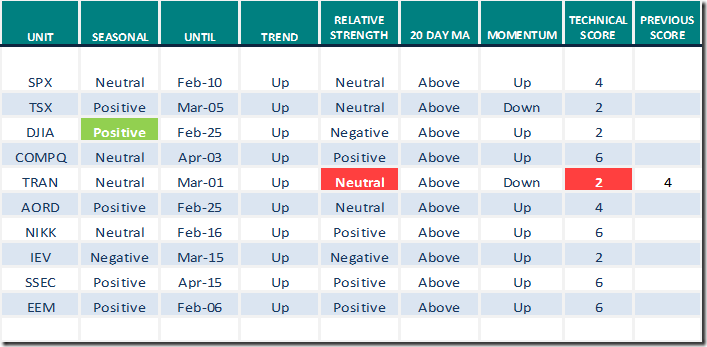
Daily Seasonal/Technical Equity Trends for January 22nd 2021
Green: Increase from previous day
Red: Decrease from previous day
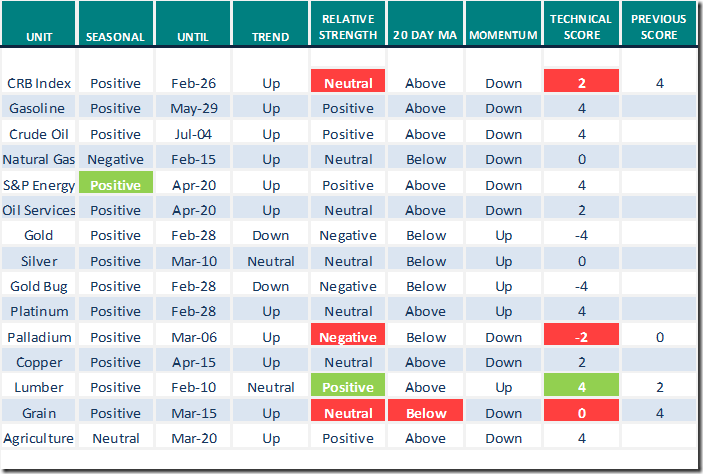
Commodities
Daily Seasonal/Technical Commodities Trends for January 22nd 2021
Green: Increase from previous day
Red: Decrease from previous day
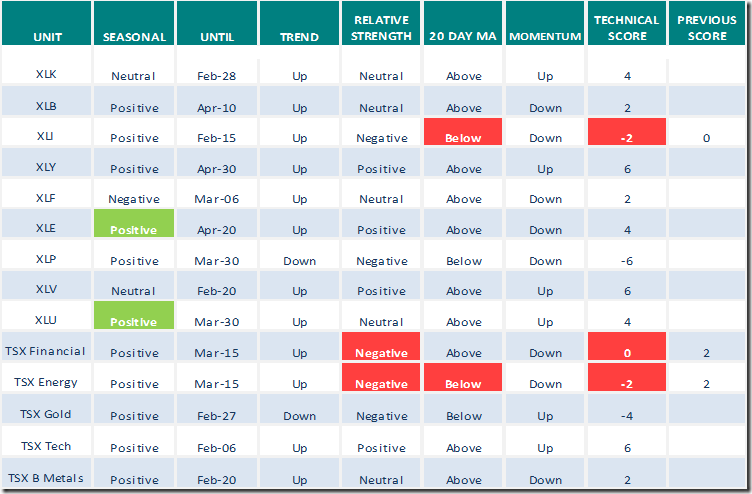
Sectors
Daily Seasonal/Technical Sector Trends for January 22nd 2021
Green: Increase from previous day
Red: Decrease from previous day
Technical Scores
Calculated as follows:
Intermediate Uptrend based on at least 20 trading days: Score 2
(Higher highs and higher lows)
Intermediate Neutral trend: Score 0
(Not up or down)
Intermediate Downtrend: Score -2
(Lower highs and lower lows)
Outperformance relative to the S&P 500 Index: Score: 2
Neutral Performance relative to the S&P 500 Index: 0
Underperformance relative to the S&P 500 Index: Score –2
Above 20 day moving average: Score 1
At 20 day moving average: Score: 0
Below 20 day moving average: –1
Up trending momentum indicators (Daily Stochastics, RSI and MACD): 1
Mixed momentum indicators: 0
Down trending momentum indicators: –1
Technical scores range from -6 to +6. Technical buy signals based on the above guidelines start when a security advances to at least 0.0, but preferably 2.0 or higher. Technical sell/short signals start when a security descends to 0, but preferably -2.0 or lower.
Long positions require maintaining a technical score of -2.0 or higher. Conversely, a short position requires maintaining a technical score of +2.0 or lower
Changes Last Week
The Canadian Technician
Greg Schnell continues to favour the medium/long term outlook for commodity stocks, but is concerned about their short term overbought levels. Following is a link:
A Drip Or A Drop? | The Canadian Technician | StockCharts.com
Technical Scoop
Thank you to David Chapman and www.EnrichedInvesting.com for a link to their weekly comment. Headline reads, “Biden begins, market highs, debt surge, inflation hold, everything bubble, K recovery, venture boom”. Following is the link to the January 25th report at
https://enrich.frontlinesafeguard.com/library/#commentary-newsletters
Changes in Seasonality Rating
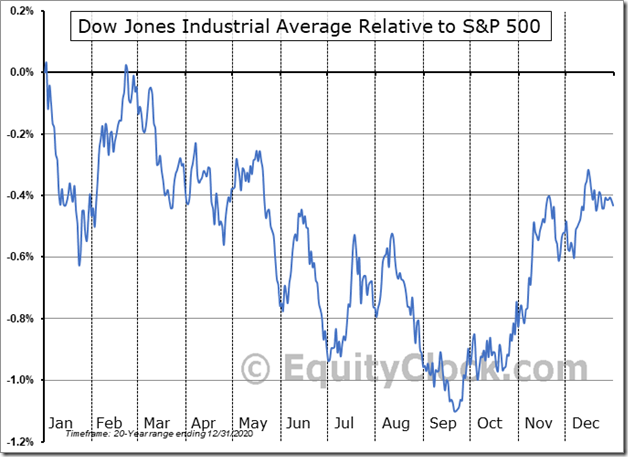
Dow Jones Industrial Average from Neutral to Positive
S&P Energy and XLE: Neutral to Positive
S&P Utilities: Neutral to Positive
Technical Notes for Friday January 22nd
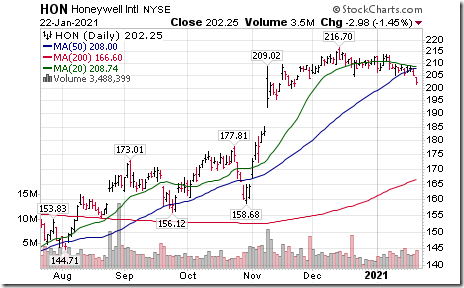
Honeywell (HON), a Dow Jones Industrial Average stock moved below $204.85 completing a double top pattern.
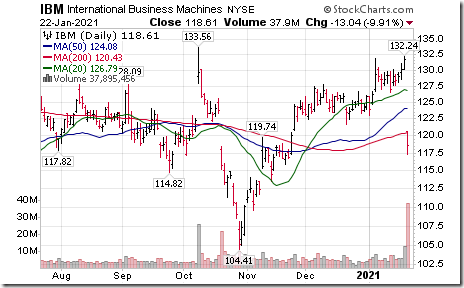
IBM ((IBM) moved below support at $121.72 after reporting lower than consensus fourth quarter revenues.
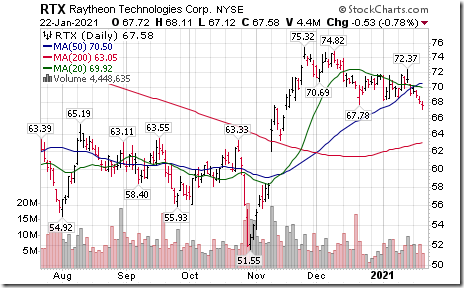
Raytheon Technologies (RTX), an S&P 100 stock moved below $67.78 completing a double top pattern.
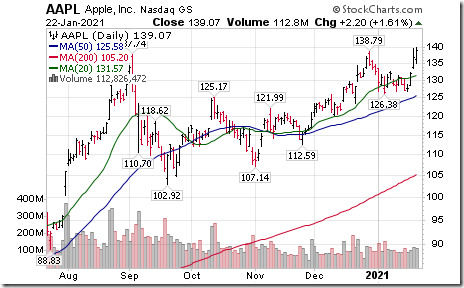
Apple (AAPL), a Dow Jones Industrial Average stock moved above $138.79 to an all-time high extending an intermediate uptrend
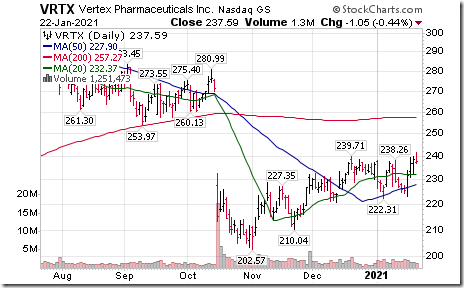
Vertex Pharmaceutical (VRTX), a NASDAQ 100 stock moved above $239.71 extending an intermediate uptrend.
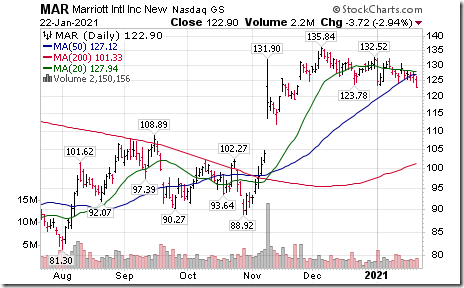
Marriott (MAR) moved below $123.78 and $123.78 completing a double top pattern.
S&P 500 Momentum Barometers
The intermediate Barometer dropped 4.61 on Friday and dropped 2.81 last week to 71.34. It remains intermediate overbought and is trending down.
The long term Barometer slipped 1.00 on Friday and eased 0.40 last week to 90.18. It remains extremely overbought, but has yet to set a trend.
TSX Momentum Barometers
The intermediate Barometer dropped 2.12 on Friday and fell 4.04 last week to 63.90. It remains intermediate overbought and is trending down.
The long term Barometer slipped 2.05 on Friday and eased 1.88 last week to 77.07. It remains intermediate overbought and trending down.
Disclaimer: Seasonality and technical ratings offered in this report and at
www.equityclock.com are for information only. They should not be considered as advice to purchase or to sell mentioned securities. Data offered in this report is believed to be accurate, but is not guaranteed
This post was originally publised at Vialoux's Tech Talk.


