
by Lance Roberts, RIA
During the past couple of weeks, I have discussed the rising levels of exuberance in the markets. Importantly, that exuberance combined with surging margin debt levels warns of an impending correction.
I recently discussed why this is not a “new bull market,” which changes the dynamic of the understanding of “risk” in markets.
Following actual “bear markets,” investor sentiment is crushed, valuations revert toward their long-term means, and price trends are negative. Notably, few investors are willing to “buy” assets in the market. However, “corrections” do not accomplish any of those outcomes.
While the mainstream definition of a “bear market” is a 20% decline, such has little relevance to what constitutes a “bear market.” As noted in “March Was Only A Correction,” there is a significant difference.
“The distinction is essential.
- ‘Corrections’ generally occur over short time frames, do not break the prevailing trend in prices, and are quickly resolved by markets reversing to new highs.
- ‘Bear Markets’ tend to be long-term affairs where prices grind sideways or lower over several months as valuations are reverted.
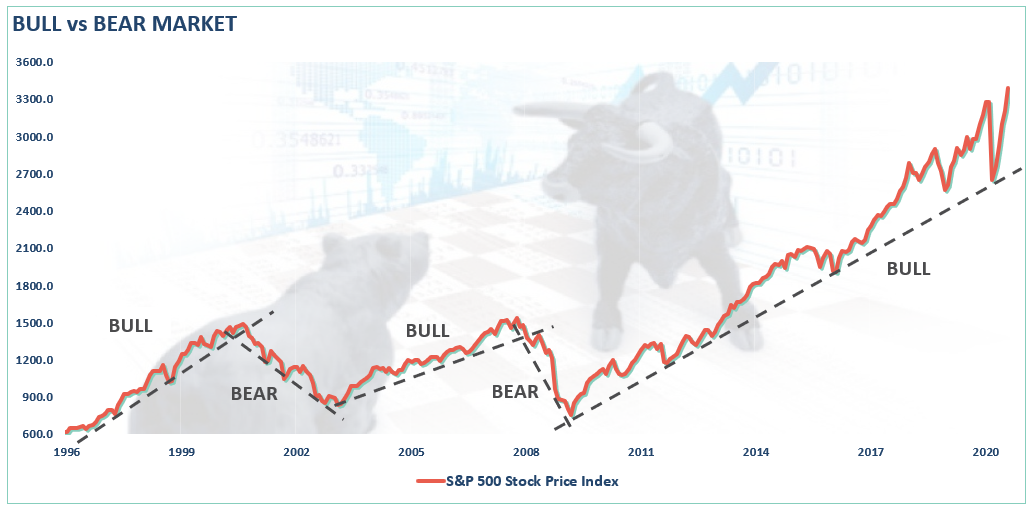
Using monthly closing data, the “correction” in March was unusually swift but did not break the long-term bullish trend. Such suggests the bull market that began in 2009 is still intact as long as the monthly trend line holds.
Several other factors confirm March was just a correction.

Investors Are All In
As noted, following an actual “bear market,” investors are very slow to return to the market. Following the “Dot.com” crash, it took several years before investors returned their allocation levels to “fully allocated” levels. The same occurred following the “Financial Crisis.”
However, following the March decline, investors quickly allocated back into equities, which coincides with corrections rather than bear markets.
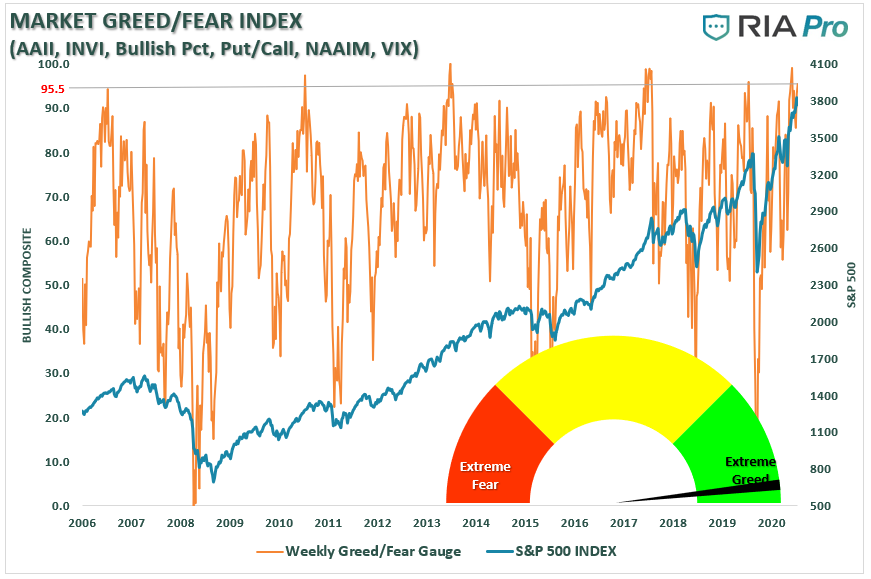
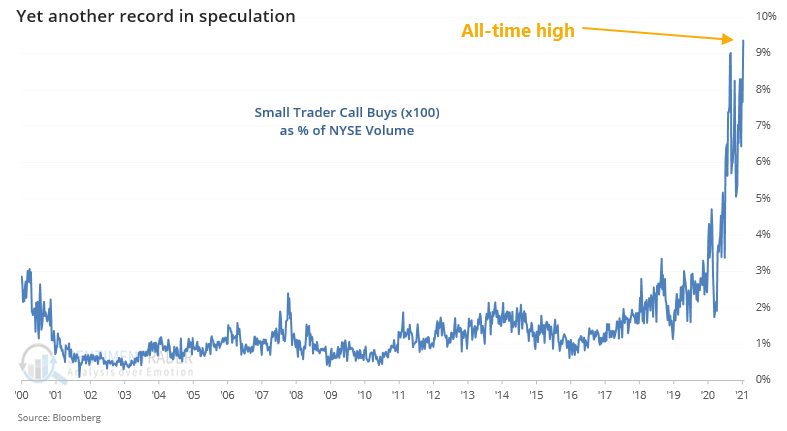
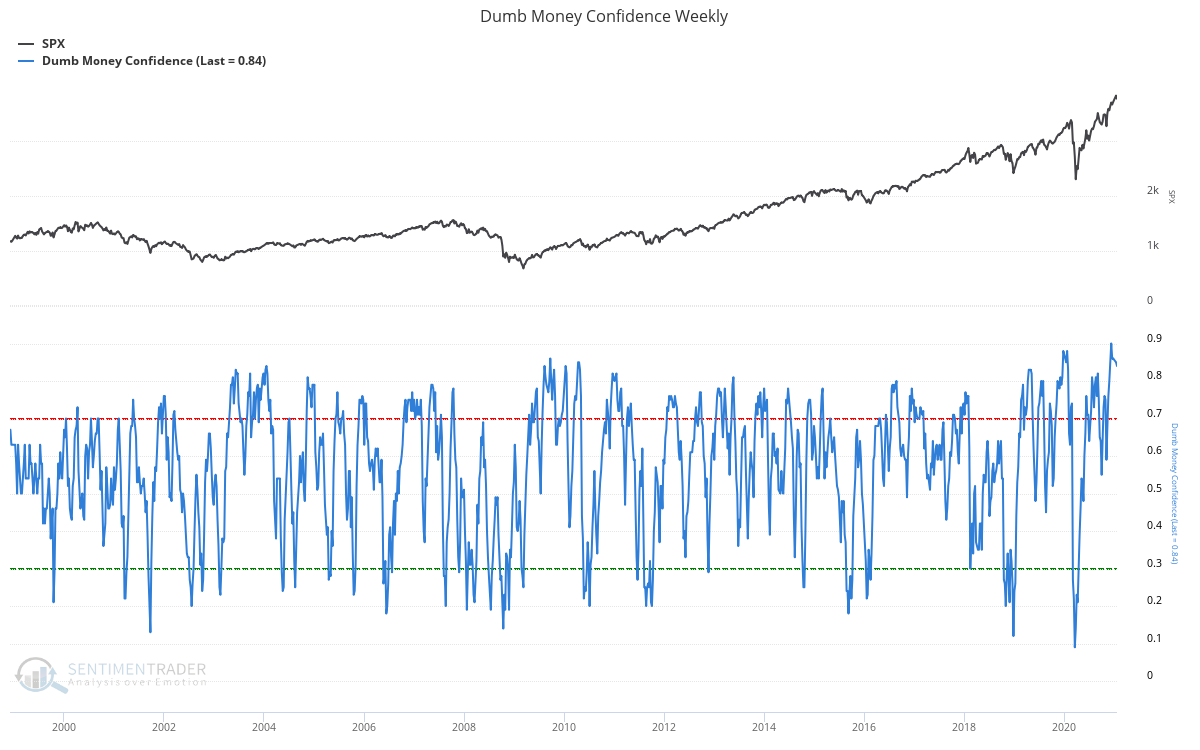
Further, as we discussed in “Sign, Sign, Everywhere A Sign,” investors are now “all in” in terms of portfolio risk. As noted by SentimenTrader on Saturday:
“We didn’t think traders could get any more speculative than they were at the end of August. We were wrong. For the first time, small trader call buying (adjusted for equivalent shares) exceeded 9% of total NYSE volume last week.”
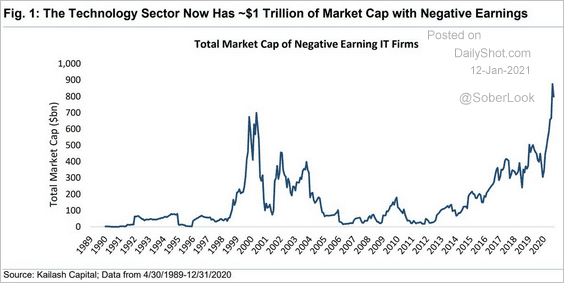
As we saw at the peak in 1999, investors are again piling into companies reporting “negative” earnings. Following bear markets, speculative behavior such as this takes years to return.
Most importantly, “bubbles” are not formed immediately following a bear market. Instead, bubbles are a function of “bull markets” where investors rationalize why “this time is different.” As Jeremy Grantham noted recently:
“The long, long bull market since 2009 has finally matured into a fully-fledged epic bubble. Featuring extreme overvaluation, explosive price increases, frenzied issuance, and hysterically speculative investor behavior. I believe this event will be recorded as one of the great bubbles of financial history, right along with the South Sea bubble, 1929, and 2000.“
The Issue Of Margin Debt
Another indication we are not in a “new bull market,” but rather an extension of the bull market that began in 2000, is occurring in margin debt. As I explained previously:
“Margin debt is not a technical indicator for trading markets. What margin debt represents is the amount of speculation that is occurring in the market. In other words, margin debt is the ‘gasoline,’ which drives markets higher as the leverage provides for the additional purchasing power of assets. However, ‘leverage’ also works in reverse as it supplies the accelerant for more significant declines as lenders ‘force’ the sale of assets to cover credit lines without regard to the borrower’s position.”
The last sentence is the most important. The issue with margin debt, in particular, is that the unwinding of leverage is NOT at the investor’s discretion. It is at the discretion of the broker-dealers that extended that leverage in the first place. (In other words, if you don’t sell to cover, the broker-dealer will do it for you.) When lenders fear they may not recoup their credit-lines, they force the borrower to either put in more cash or sell assets to cover the debt. The problem is that “margin calls” generally happen all at once, as falling asset prices impact all lenders simultaneously.
Margin debt is NOT an issue – until it is.

Margin Debt Confirms March Correction
Another indication that March was only a correction and not a bear market is that free-cash balances remain negative. During bear markets, banks force borrowers to cover margin loans as prices drop. Such causes further declines in asset prices, causing more margin calls, causing further price declines. The process continues until liquidation of margined investors is complete, and free-cash balances return to positive territory. That did not occur following the March correction.
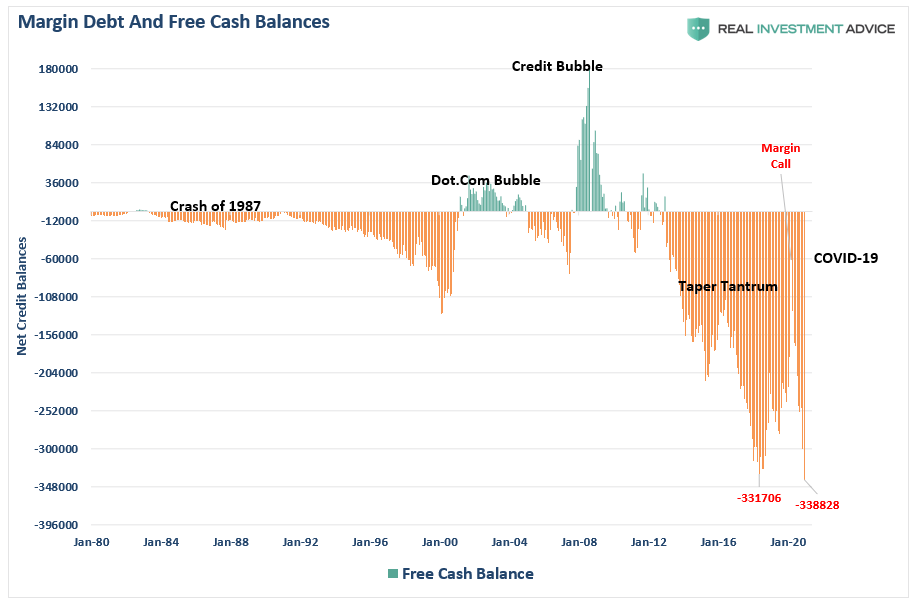
In fact, despite a short-term correction in margin debt, the “speculative frenzy” following the correction pushed margin debt back to record highs.
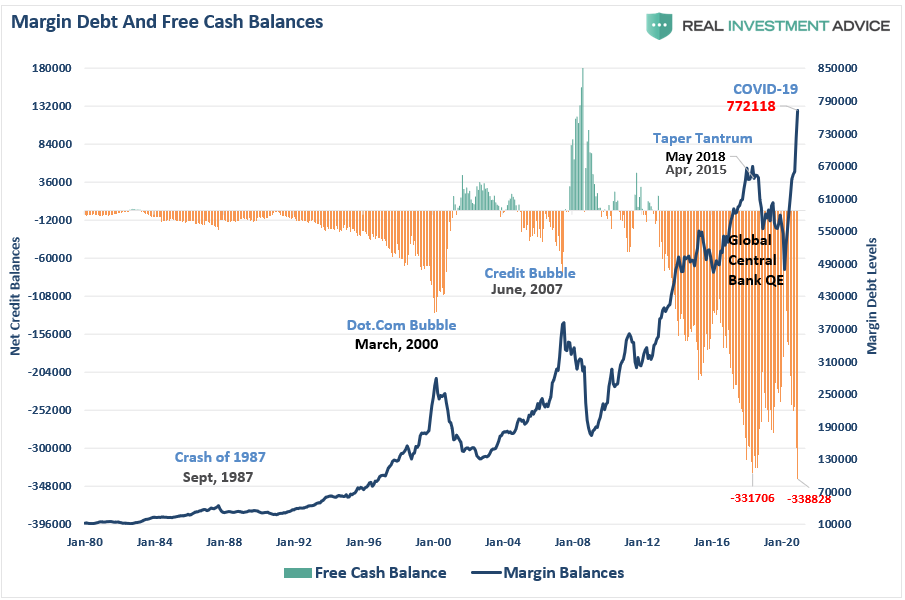
As noted, when markets are rising, and investors are taking on additional leverage to increase buying power, margin debt supports the advance. However, the magnitude of the recent surge in margin debt also confirms the current levels of investor exuberance.
The chart shows the relationship between cash balances and the market. I have inverted free cash balances, so the relationship between increases in margin debt and the market is better represented.
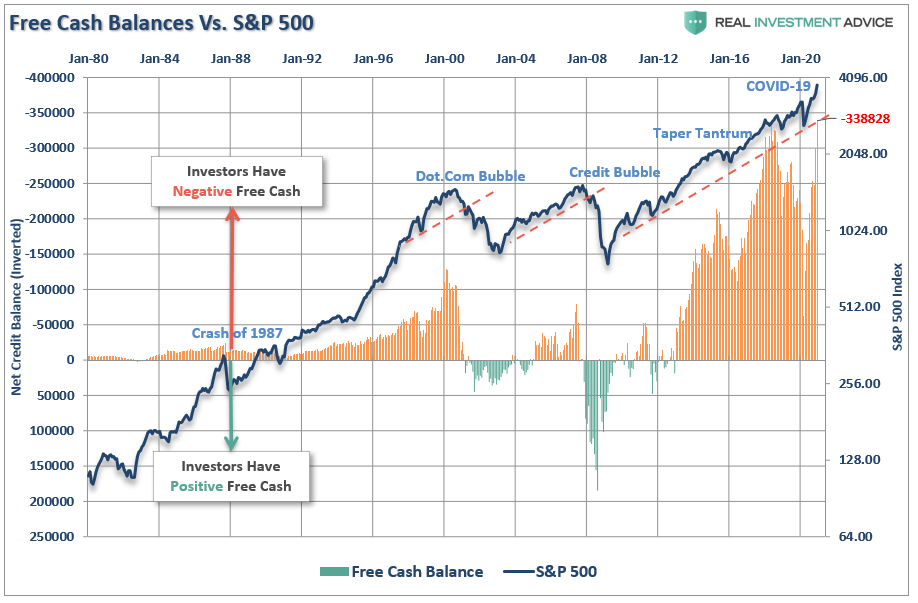
Note that during the 1987 correction, the 2015-2016 “Brexit/Taper Tantrum,” the 2018 “Rate Hike Mistake,” the “COVID Dip,” the market never broke its uptrend, AND cash balances never turned positive.
Both a break of the rising bullish trend and positive free cash balances were the 2000 and 2008 bear markets’ hallmarks. Such is another reason why March was just a “correction.”

Margin Debt Suggests Risk Is Elevated
Margin data goes back to 1959 to get a long-look at margin debt and its relationship to the market. The chart below is a “stochastic indicator” of margin debt overlaid against the S&P 500.

The stochastic indicator is a momentum indicator developed by George C. Lane in the 1950s. The chart shows the position of the most recent margin debt level relative to its previous high-low range. The indicator measures the momentum of margin debt by comparing the closing level with the range over the past 21-months.
The stochastic indicator represents the speed and momentum of margin debt level changes. Such means the stochastic indicator changes direction before the market. As such, it can be considered a leading indicator.
When margin debt is increasing rapidly, such has usually been coincident with short to intermediate-term peaks in markets. Given that investors tend to “buy the most at the top,” rapidly increasing levels of margin debt tend to confirm exuberance.
The two charts below confirm the acceleration of speculative risk increases in the market. The chart below is the rate-of-change of margin debt from the preceding 12-month low.
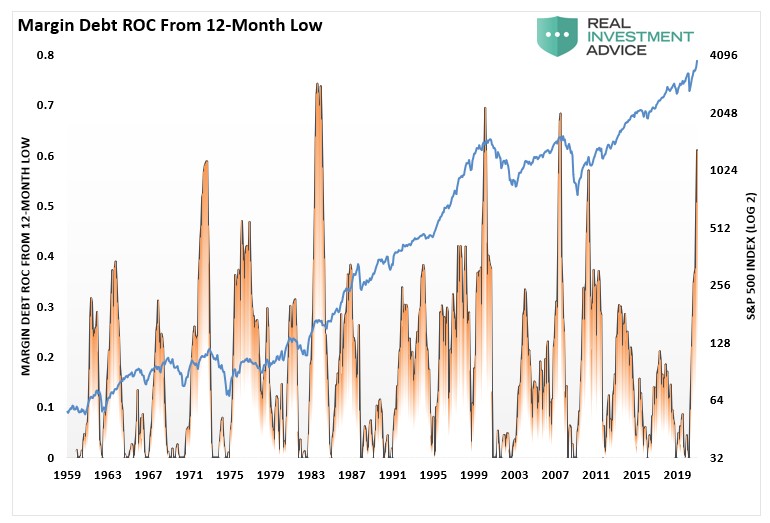
The chart confirms the same by measuring the raw rate-of-change in margin debt over the preceding 8-months.
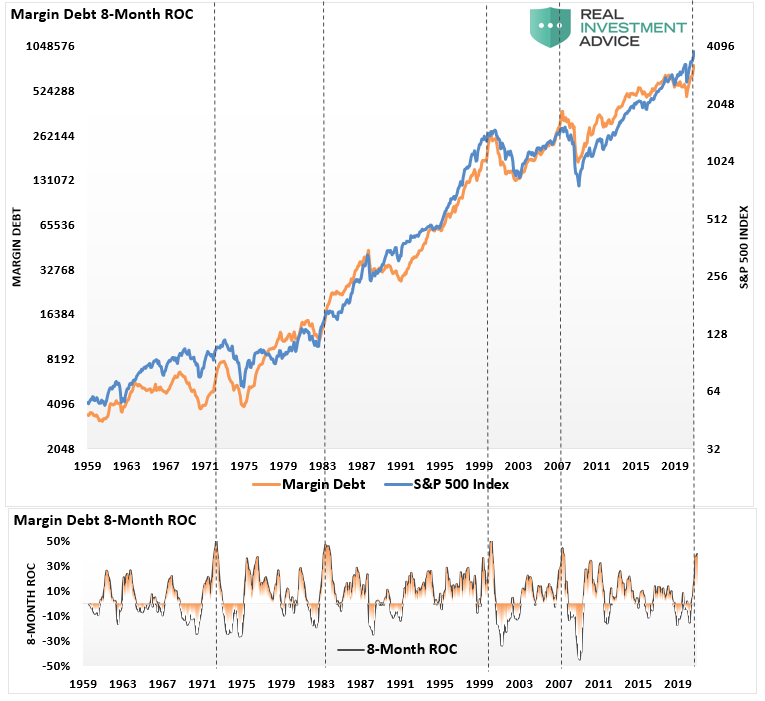
By all measures, margin debt acceleration is a sign of caution for investors in the short-term. Such is particularly the case, as noted yesterday, there are “alarm bells” in the most speculative areas of the market.

It’s All Coincident
Margin debt, much like valuations, are “terrible market timing” indicators and should not be used as such. Rising levels of margin debt, and high valuations, are a reflection of investor psychology and overconfidence.
I agree and disagree that margin debt levels are simply a function of market activity and have no bearing on the market’s outcome. As we saw in March, the double-whammy of collapsing oil prices and economic shutdown in response to the coronavirus triggered a sharp sell-off fueled by margin liquidation.
Currently, the majority of investors have forgotten about March. Or worse, assume it can’t happen again for a variety of short-sighted reasons. However, investors are more exuberant now than at the peak of the market in 2000 or 2008.
Excuses Won’t Work
Sure, this time could indeed be different. That has remained the “sirens song” of investors since March. However, as Sentiment Trader summed up the last time we wrote on this topic, such is usually not the case.
“Whenever some of this data fails to lead to the expected outcome for a few weeks or more, we hear the usual chorus of opinions about why it doesn’t work anymore. This has been consistent for 20 years, like…
- Decimalization will destroy all breadth figures (2000)
- The terror attacks will permanently alter investors’ time preferences (2001)
- The pricking of the internet bubble will forever change option skews (2002)
- Easy money will render sentiment indicators useless (2007)
- The financial crisis means relying on any historical precedents are invalid (2008)
- The Fed’s interventions mean any indicators are no longer useful (2010 – present)
All of these sound good, and for a time it seemed like they were accurate. Then markets would revert and the arguments would get swept into the dustbins of history.”
It’s not too late to take action to preserve capital now, so you have the money to invest with later.