by Anu Ganti, Senior Director, Index Investment Strategy, S&P Dow Jones Indices
2020 was a year of two reversals for the market. First, equities recovered from the depths of March to finish the year strongly, and second, smaller-cap and value stocks staged a roaring comeback in the final quarter.
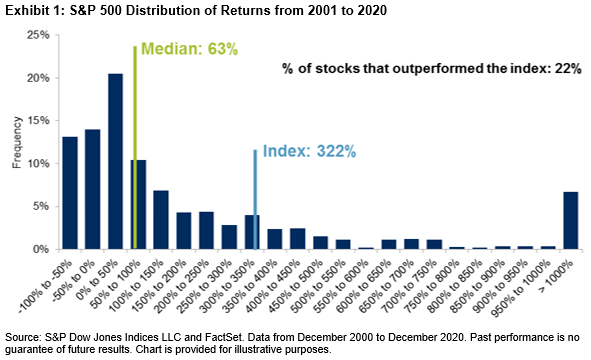
We can better understand the second reversal by analyzing the market’s distribution of returns and the performance of stocks relative to the index as a whole. Exhibit 1 illustrates this for the S&P 500® for the past 20 years. Of the 980 stocks that were in the index during this period, only 211, or 22%, outperformed. When only 22% of the stocks beat the market, stock picking is hard, underscoring the persistent underperformance of most active managers.
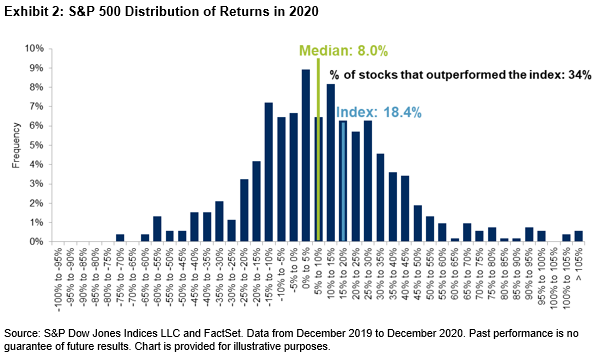
Exhibit 1 summarized 20 years of data, but we also see the challenges of stock selection in most individual years, and 2020 was no exception. Exhibit 2 shows that the S&P 500’s return for 2020 (18.4%) was much higher than the median stock’s return of 8%. The outperformance of large-cap stocks meant that only 34% of stocks beat the index.
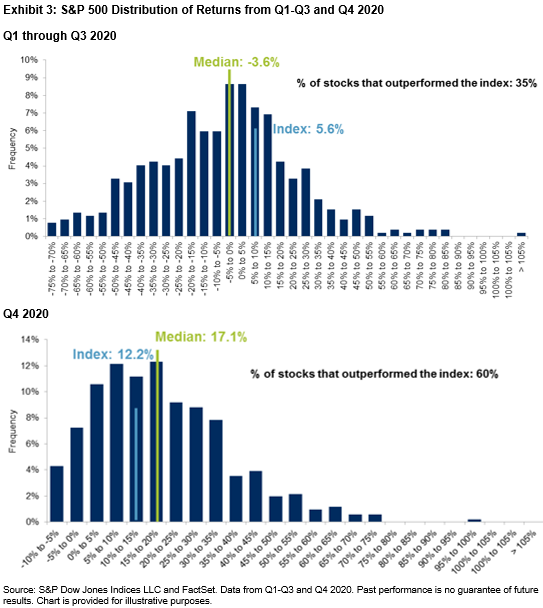
However, the path for stock-pickers was not a straight one in 2020. Exhibit 3 shows that from Q1 through Q3, the S&P 500 posted a return of 5.6%, as mega-caps outperformed during the period. As a result, only 35% of stocks were able to outperform the index.
In contrast, in Q4, the market reversed course, where the S&P 500’s return of 12.2% was much below the median of 17.1%, signaling the recovery of smaller-cap stocks. Therefore, 60% of stocks were able to outperform the index, almost double what we saw in the first three quarters.
This analysis has interesting implications for active management: The dominance of mega-caps hindered stock selection from Q1 through Q3. Meanwhile, in Q4, the comeback of smaller caps lowered the threshold for success, leading to a greater hit rate of outperforming the index. It is not solely the distribution of returns, but the return distribution across the cap range that matters.
As most active portfolios are closer to equal than cap weighted, it is also important to remember that smaller-cap outperformance favors equal-weight indices, which led to S&P 500 Equal Weight’s recent reversal. If the trends from Q4 continue, we can anticipate a more favorable environment for active managers. Whether they will be able to take advantage of it remains to be seen.
The posts on this blog are opinions, not advice. Please read our Disclaimers.
Copyright © S&P Dow Jones Indices