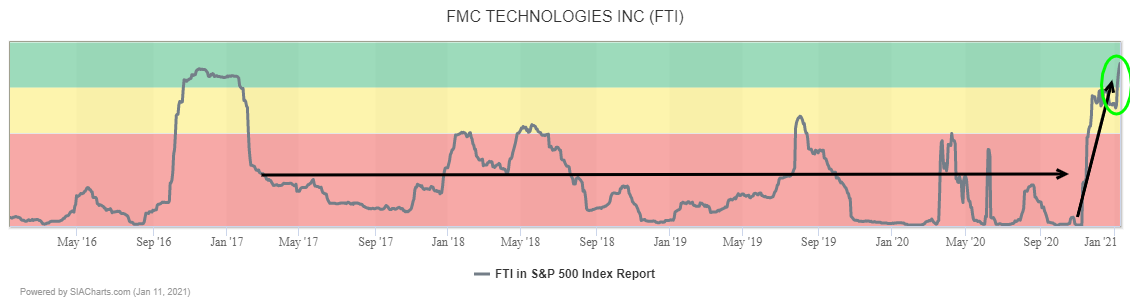
After spending most of the last four years stuck in the red zone, oilfield equipment producer TechnipFMC (FTI) recently returned to the Green Favored Zone of the SIA S&P 500 Index Report for the first time since February of 2017. Yesterday, FTI moved up another 12 spots to 64th place and it is up 73 spots in the last month.
A major breakout is underway in TechnipFMC (FTI) shares. After selling off in the early part of the year, the shares spent most of 2020 stuck trading sideways and base building in the $5.00 to $10.00 range. Following a successful retest of the low end of that range in October, the shares have come under renewed accumulation with higher lows indicating increased support. Last week’s breakout over $10.00 completed the base and signaled the start of a new uptrend. Since then, the shares have continued to climb on increasing volumes, a sign of renewed investor interest.
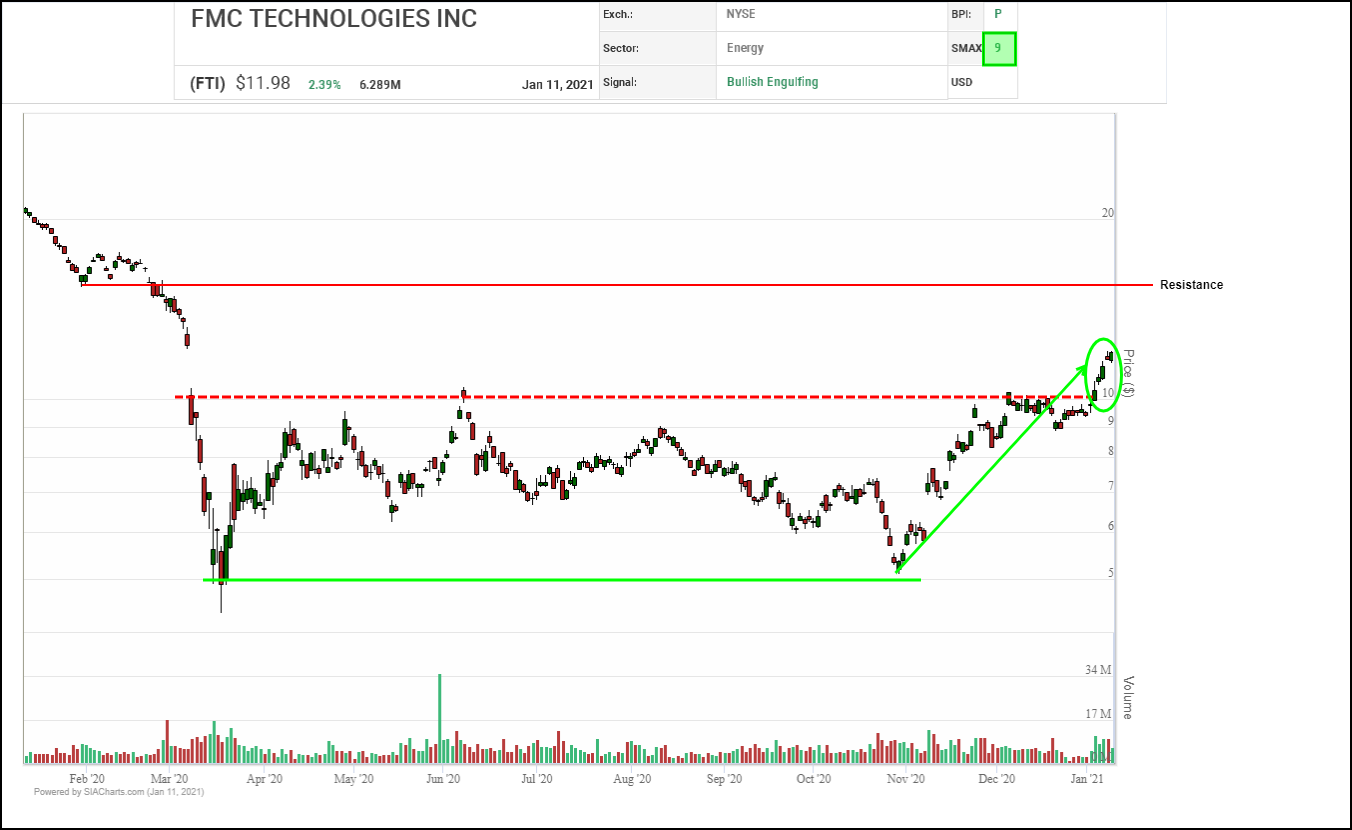
Next potential upside resistance appears near $15.00 a round number where multiple measured moves converge with a previous trading range. Initial support moves up toward $10.50 from the $10.00 breakout point.
TechnipFMC (FTI) shares have been under renewed accumulation since October, completing a series of bullish Double Top breakouts. FTI recently broke out of a base clearing $10.00, and yesterday, it snapped a downtrend line to confirm the start of a new upward trend.

With the shares now approaching the $12.00 level next potential upside resistance appears near $12.95, then $14.25 based on horizontal counts, then the $15.00 round number and the $16.05 to $17.40 area, a previous trading range. Initial support appears near $11.00 based on a 3-box reversal.
With a bullish SMAX score of 9, FTI is exhibiting near-term strength against the asset classes.
Disclaimer: SIACharts Inc. specifically represents that it does not give investment advice or advocate the purchase or sale of any security or investment whatsoever. This information has been prepared without regard to any particular investors investment objectives, financial situation, and needs. None of the information contained in this document constitutes an offer to sell or the solicitation of an offer to buy any security or other investment or an offer to provide investment services of any kind. As such, advisors and their clients should not act on any recommendation (express or implied) or information in this report without obtaining specific advice in relation to their accounts and should not rely on information herein as the primary basis for their investment decisions. Information contained herein is based on data obtained from recognized statistical services, issuer reports or communications, or other sources, believed to be reliable. SIACharts Inc. nor its third party content providers make any representations or warranties or take any responsibility as to the accuracy or completeness of any recommendation or information contained herein and shall not be liable for any errors, inaccuracies or delays in content, or for any actions taken in reliance thereon. Any statements nonfactual in nature constitute only current opinions, which are subject to change without notice.