by Don Vialoux, EquityClock.com
The Bottom Line
Major equity indices around the world moved higher last week. Greatest influences remain growing evidence of a second wave of the coronavirus (negative) and timing of distribution of a vaccine (positive)
Observations
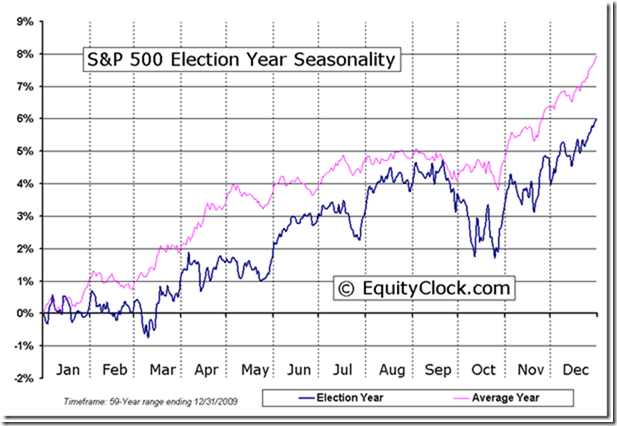
The Dow Jones Industrial Average and S&P 500 Index are following their historic trend after a U.S. Presidential Election. The strongest 12 week period during the four year U.S. Presidential Cycle has occurred from U.S. Presidential Election Day to Inauguration Day on January 20th. Since Election Day this year, the Dow Jones Industrial Average has advanced 13.2%, the S&P 500 Index has gained 13.5%. and the TSX Composite Index has increased.13.2%.
What about this time? Biden was confirmed as President last week, Democrats effectively will take control of the Senate on January 20th with Kamala Harris controlling the majority vote in the Senate and Democrats maintained control of the House of Representatives with a smaller majority. Democrats theoretically will have full control of all three political levels of the U.S. government on January 20th. Caveat: votes by Senator Joe Manchin, a Democrat with Republican leanings is likely to regulate the amount of “progressive” legislation that the Democrats plan to launch.
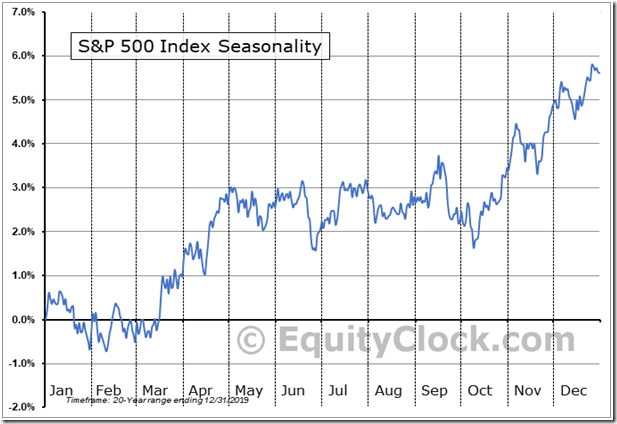
The “Santa Claus rally” worked exceptionally well this time. The rally period normally occurs from the close on December 14th to January 7th. Prior to this year, the S&P 500 Index gained in 22 of the past 30 periods since 1990 for an average return per period of 1.53%. The TSX Composite gained in 25 of the past 30 periods for an average return per period of 2.13%. During this past period, the S&P 500 Index added 4.29% and the TSX Composite Index gained 3.68%. Reasons for the Santa Claus rally include yearend “window dressing” by institutional investors, favourable comments by investment dealers about prospects for next year, the end of tax loss selling pressures by individual investors, start of investment of yearend bonuses received by individual investors (frequently placed into RRSPs in Canada) and a buoyant investment attitude by all investors related to the Christmas/New Year season.
What about the “Santa Claus Hangover? Following is a link to a recent video by Larry Williams that explains the “Santa Claus Rally” as well as the “Santa Claus Hangover” in the U.S. equity market:
Santa Claus Rally Exposed | Larry Williams | Real Trading Special (12.07.20) – YouTube
On average, the S&P 500 Index during the past 20 periods from January 8th to February 14th has dropped 1.5% per period. Effectively, on average, all of the historic gains recorded during the Santa Claus Rally period were lost during the Santa Claus Hangover period. This is the time of year when U.S. consumers and investors are paying down debts accrued during the Santa Claus Rally period.
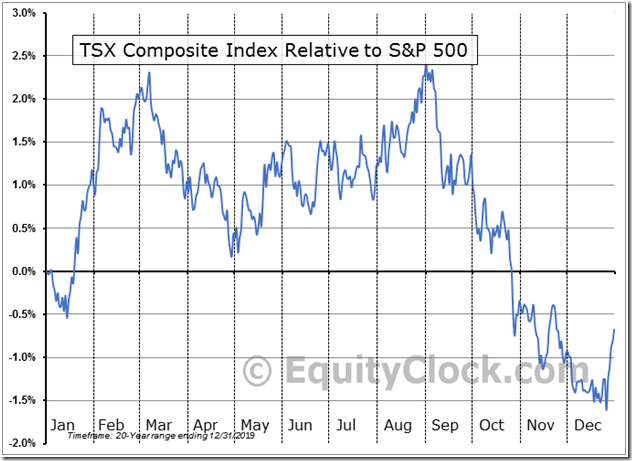
Note that the “Santa Claus Hangover” normally does not happen in the Canadian equity market. The main reason: Canadian investors focus on contributing to their RRSPs during the first 60 days in the New Year and subsequently invest more funds into the equity market. Strongest period in the year for the TSX Composite Index relative to the S&P 500 Index is from mid-December to the first week in March. As indicated in the chart below, average gain per period for the TSX Composite Index relative to the S&P 500 Index during the past 20 periods was 3.3%. Performance of the TSX Composite Index relative to the S&P 500 Index last week suggests that history is repeating.
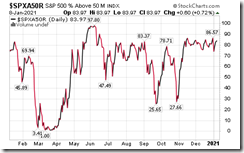
Medium term technical indicator for U.S. equity markets (e.g. Percent of S&P 500 stocks trading above their 50 day moving average) moved slightly lower last week. It remained extremely intermediate overbought above 80.00%. See Barometer chart at the end of this report.
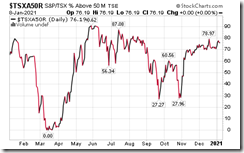
Medium term technical indicator for Canadian equity markets moved slightly higher last week. It remained intermediate overbought. See Barometer chart at the end of this report.
Short term short term momentum indicators for U.S. markets/commodities/sectors (20 day moving averages, short term momentum indicators) moved higher last week and remain elevated.
Short term momentum indicators for Canadian markets/sectors also moved higher last week and remain elevated.
Year-over-year 2020 consensus earnings declines by S&P 500 companies ebbed again from our last report on December 21st. According to www.FactSet.com, fourth quarter earnings are expected to drop 8.8% on a year-over-year basis (versus previous 9.7% decline) and revenues are expected to increase 0.4% (versus previous 0.1% increase). Earnings for all of 2020 are expected to fall 13.3% (versus previous 13.6% decline) and revenues are expected to decline 1.6% (versus previous 1.8% decline).
Consensus estimates for earnings and revenues by S&P 500 companies turn positive on a year-over-year basis in the first quarter of 2021. According to www.FactSet.com earnings in the first quarter of 2021 on a year-over-year basis are expected to increase 16.5% (versus previous 15.6% increase) and revenues are expected to increase 3.9% (versus previous 3.6% increase). Earnings in the second quarter are expected to increase 46.1 % (versus previous 45.0% increase) and revenues are expected to increase 14.1% (versus previous 13.7% increase). Earnings for all of 2021 are expected to increase 22.6% (versus previous 22.1% increase) and revenues are expected to increase 8.2% (versus previous 7.9% increase).
Economic News This Week
December U.S. Consumer Price Index to be released at 8:30 AM EST on Wednesday is expected to increase 0.4% versus a gain of 0.2% in November. Excluding food and energy, December Consumer Price Index is expected to increase 0.1% versus a gain of 0.2% in November.
Beige Book is released at 2:00 PM EST. on Wednesday.
December U.S. Producer Price Index to be released at 8:30 AM EST on Friday is expected to increase 0.3% versus a gain of 0.1% in November. Excluding food and energy, December Producer Price Index is expected to increase 0.2% versus a gain of 0.1% in November.
January Empire State Manufacturing Survey to be released at 8:30 AM EST on Friday is expected to increase to 6.15 from 4.90 in December.
December U.S. Retail Sales to be released at 8:30 AM EST on Friday are expected to slip 0.3% versus a decline of 1.1% in November. Excluding auto sales, December Retail Sales are expected to slip 0.3% versus a decline of 0.9% in January.
December Capacity Utilization to be released at 9:15 AM EST on Friday is expected to improve to 73.5% from 73.3% in November. December Industrial Production is expected to increase 0.4% versus a gain of 0.4% in November.
November Business Inventories to be released at 10:00 AM EST on Friday are expected to increase 0.4% versus a gain of 0.7% in October.
Selected Earnings News This Week
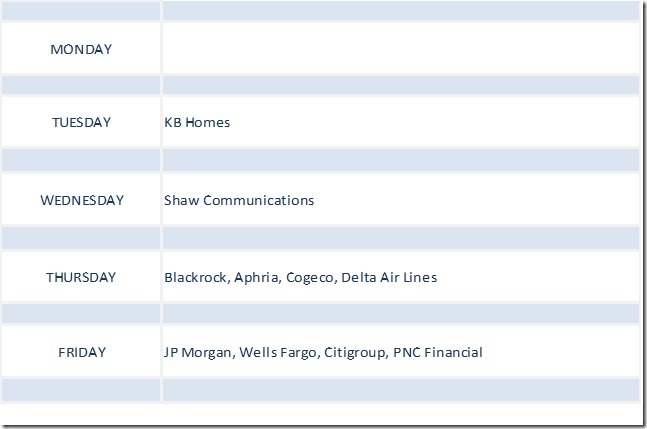
Nine S&P 500 (including one Dow Jones Industrial Average stock: JP Morgan) are scheduled to report quarterly results this week. Focus is on the U.S. Financial sector.
Trader’s Corner
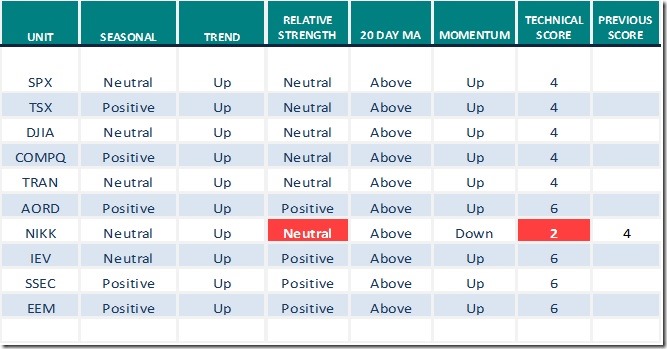
Equity Indices and Related ETFs
Daily Seasonal/Technical Equity Trends for January 8th 2021
Green: Increase from previous day
Red: Decrease from previous day
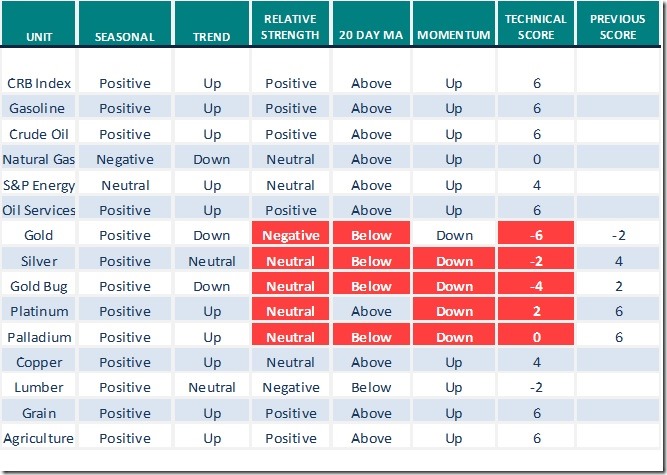
Commodities
Daily Seasonal/Technical Commodities Trends for January 8th 2021
Green: Increase from previous day
Red: Decrease from previous day
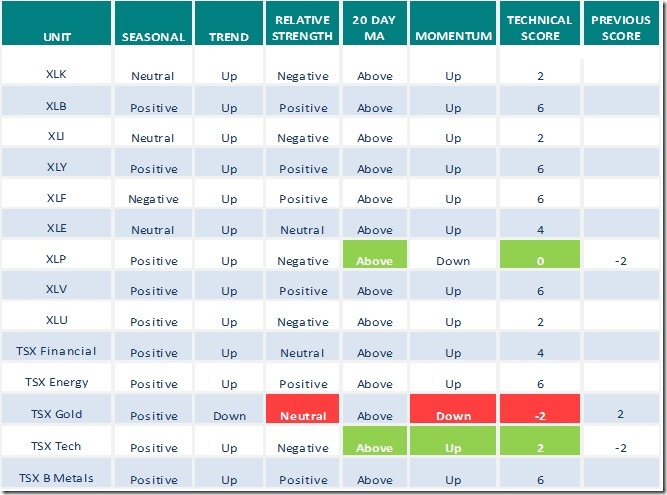
Sectors
Daily Seasonal/Technical Sector Trends for January 7th 2021
Green: Increase from previous day
Red: Decrease from previous day
Technical Scores
Calculated as follows:
Intermediate Uptrend based on at least 20 trading days: Score 2
(Higher highs and higher lows)
Intermediate Neutral trend: Score 0
(Not up or down)
Intermediate Downtrend: Score -2
(Lower highs and lower lows)
Outperformance relative to the S&P 500 Index: Score: 2
Neutral Performance relative to the S&P 500 Index: 0
Underperformance relative to the S&P 500 Index: Score –2
Above 20 day moving average: Score 1
At 20 day moving average: Score: 0
Below 20 day moving average: –1
Up trending momentum indicators (Daily Stochastics, RSI and MACD): 1
Mixed momentum indicators: 0
Down trending momentum indicators: –1
Technical scores range from -6 to +6. Technical buy signals based on the above guidelines start when a security advances to at least 0.0, but preferably 2.0 or higher. Technical sell/short signals start when a security descends to 0, but preferably -2.0 or lower.
Long positions require maintaining a technical score of -2.0 or higher. Conversely, a short position requires maintaining a technical score of +2.0 or lower
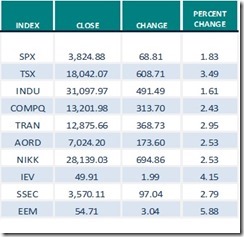
Changes Last Week
Technical Notes for Friday January 8th
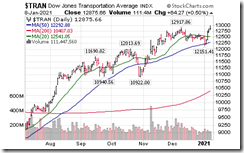
Dow Jones Transportation Average moved above 12,917.86 to an all-time high extending an intermediate uptrend. Its related ETF: IYT also moved to an all-time high.
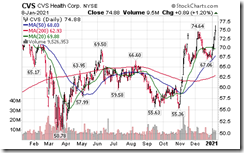
CVS Health (CVS), an S&P 100 stock moved above $74.64 and $74.66 extending an intermediate uptrend.
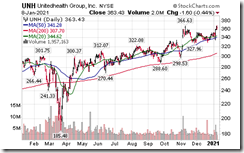
UnitedHealth Group (UNH), an S&P 100 stock moved above $366.63 to an all-time high extending an intermediate uptrend.
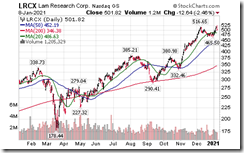
Lam Research (LRCX), a NASDAQ 100 stock moved above $516.65 to an all-time high extending an intermediate uptrend.
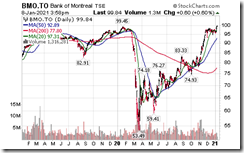
Bank of Montreal (BMO), a TSX 60 stock moved above $99.45 to an all-time high extending an intermediate uptrend.
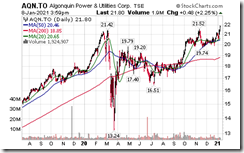
Algonquin Power (AQN), a TSX 60 stock moved above $21.52 to an all-time high extending an intermediate uptrend.
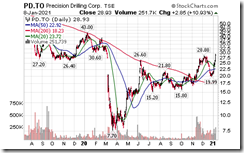
Oil Service stocks on both sides of the border continue moving higher. Precision Drilling moved above $28.88 extending an intermediate uptrend.
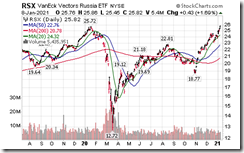
Russia ETF (RSX) moved above $25.72 to a nine year high extending an intermediate uptrend. Responding to higher crude oil prices!
S&P 500 Momentum Barometer
The Barometer added 0.72 on Friday, but slipped 2.60 last week to 83.97. It stayed above 80.00 and, therefore, remains extremely intermediate overbought.
TSX Momentum Barometer
The Barometer was unchanged on Friday and added 5.57 last week to 76.19. It remains intermediate overbought.
Disclaimer: Seasonality and technical ratings offered in this report and at
www.equityclock.com are for information only. They should not be considered as advice to purchase or to sell mentioned securities. Data offered in this report is believed to be accurate, but is not guaranteed
This post was originally publised at Vialoux's Tech Talk.


