
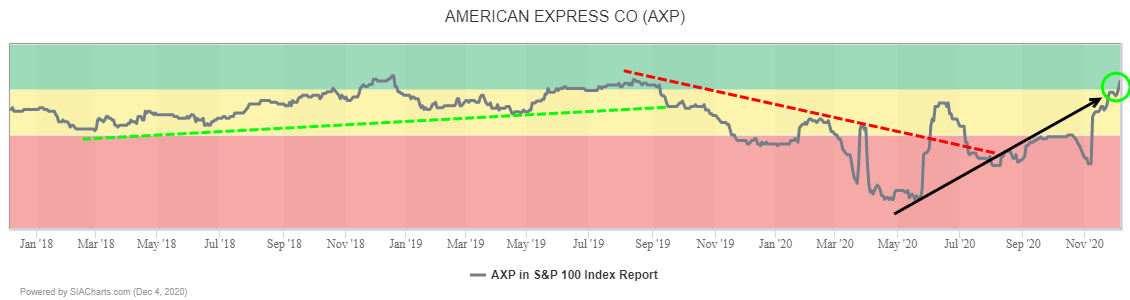
After climbing 4 spots on Friday and 46 spots in the last month to 22nd place, credit card provider American Express (AXP) has returned to the Green Favored Zone of the SIA S&P 100 Index Report for the first time since September of 2019.
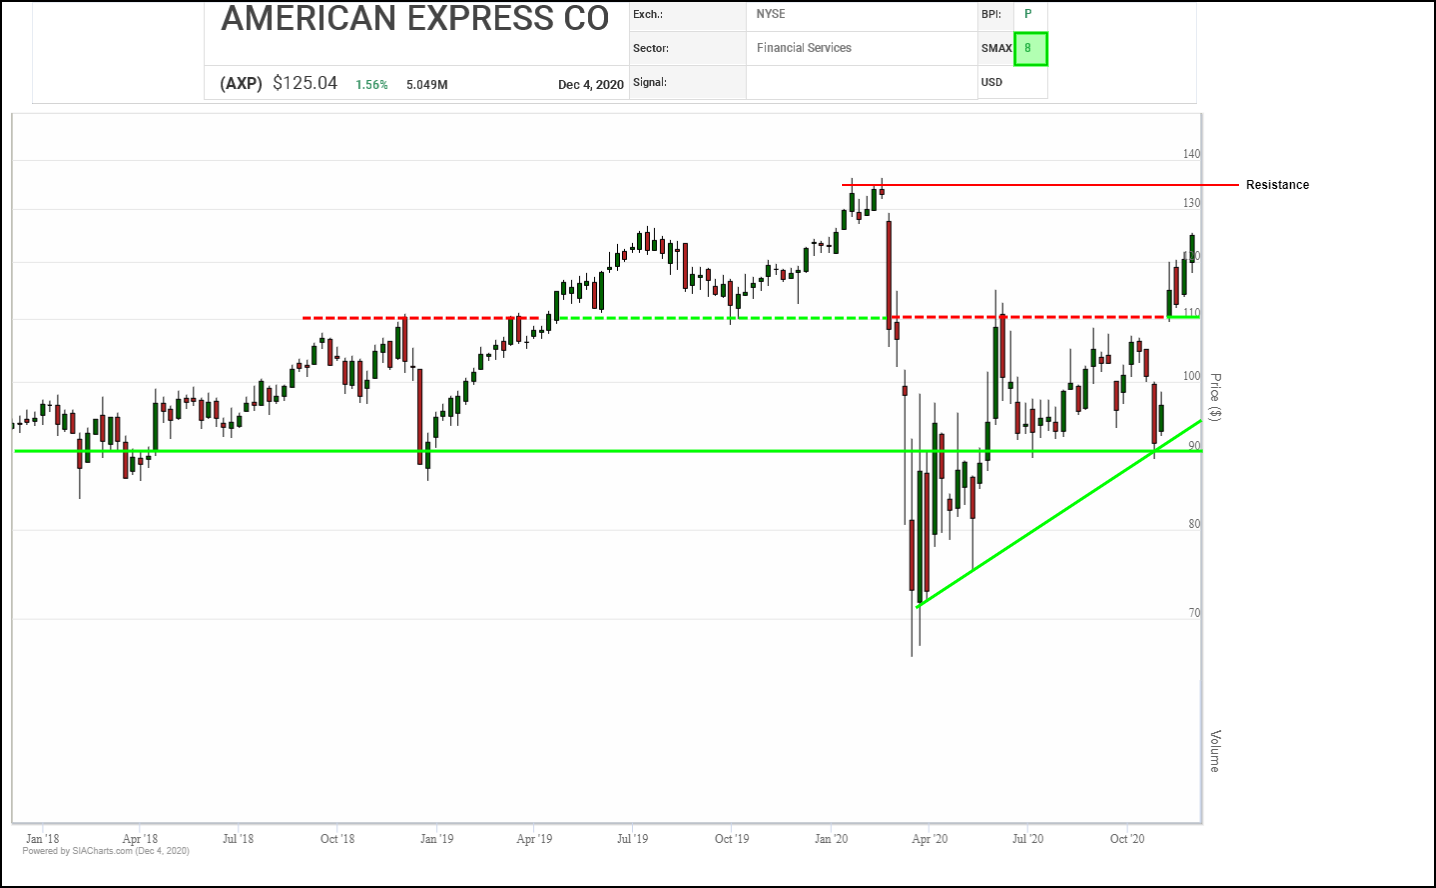
The $110.00 level in this American Express (AXP) chart provides a textbook example of how a certain level can reverse polarity, changing from support to resistance and back over time. Currently, $110.00 has become support after acting as resistance between March and November.
The recent rally has been particularly significant. Climbing up off of a successful test of channel and uptrend support near $90.00, a breakaway gap carried the shares up through $110.00, resolving a horizontal channel to the upside and completing a bullish Ascending Triangle pattern to signal the start of a new upleg, which has continued and carried the shares up toward $125.00.
Initial upside resistance appears at the 52-week high near $135.00, followed by the $145.00 to $150.00 zone where multiple measured moves and a round number cluster. Initial support has moved up toward $117.50 from $110.00.
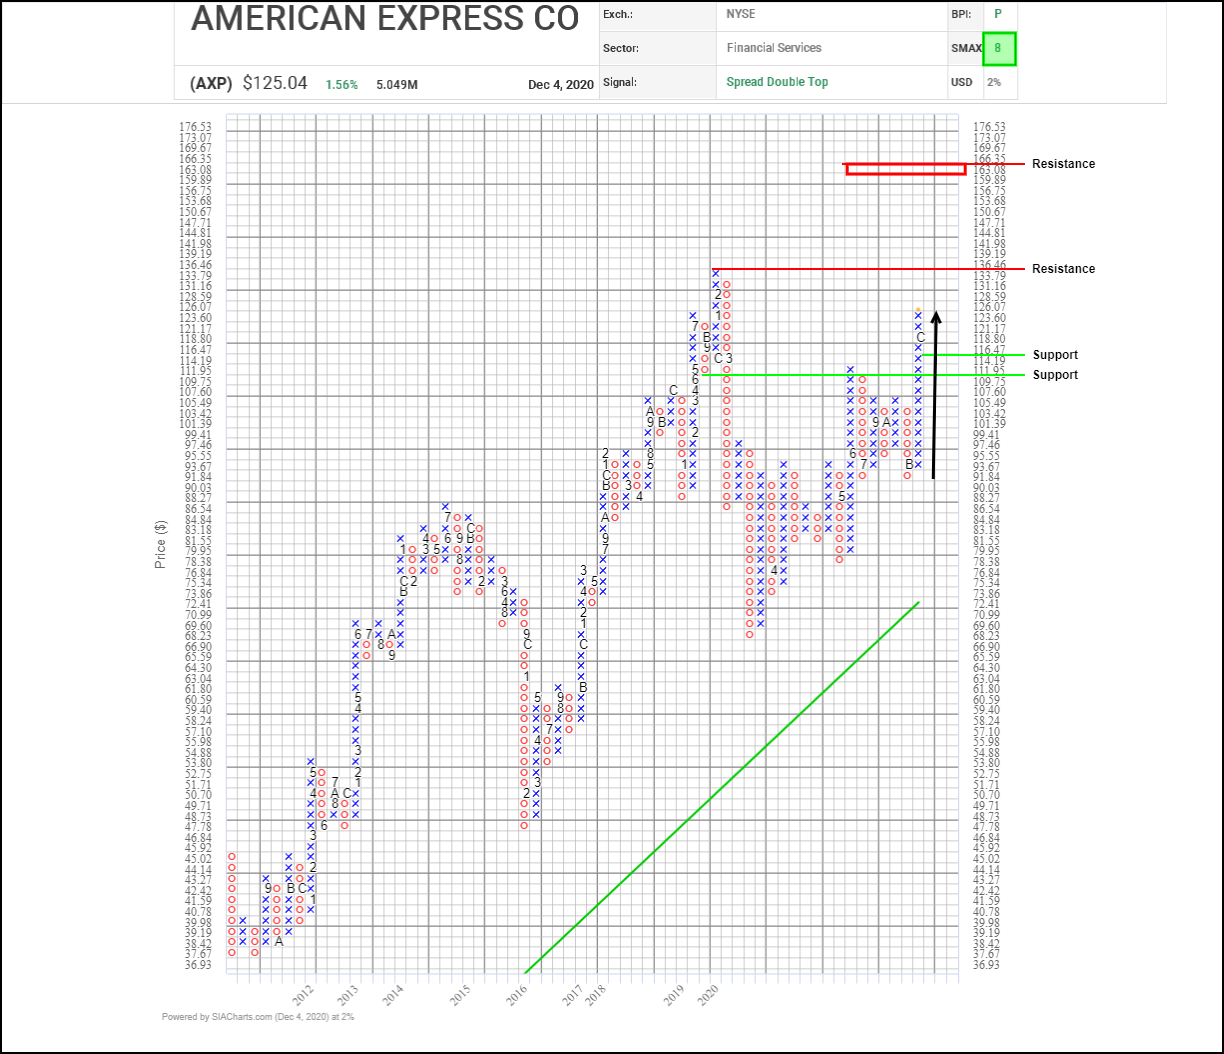
Accumulation in American Express (AXP) shares has accelerated in the last month with the shares driving up off of a successful support test near $95.00 up toward $125.00 without even a 3-box correction. Along the way, the shares have completed a bullish Triple Top pattern followed by a bullish Spread Double Top pattern, with both breakouts still active.
Initial upside resistance may appear at the previous peak near $136.45, followed on trend by the $150.00 round number and then the $163.10 to $166.35 range where vertical/horizontal counts converge. Initial support appears near $114.20 based on a 3-box reversal.
With a bullish SMAX score of 8, AXP is exhibiting near-term strength against the asset classes.
Disclaimer: SIACharts Inc. specifically represents that it does not give investment advice or advocate the purchase or sale of any security or investment whatsoever. This information has been prepared without regard to any particular investors investment objectives, financial situation, and needs. None of the information contained in this document constitutes an offer to sell or the solicitation of an offer to buy any security or other investment or an offer to provide investment services of any kind. As such, advisors and their clients should not act on any recommendation (express or implied) or information in this report without obtaining specific advice in relation to their accounts and should not rely on information herein as the primary basis for their investment decisions. Information contained herein is based on data obtained from recognized statistical services, issuer reports or communications, or other sources, believed to be reliable. SIACharts Inc. nor its third party content providers make any representations or warranties or take any responsibility as to the accuracy or completeness of any recommendation or information contained herein and shall not be liable for any errors, inaccuracies or delays in content, or for any actions taken in reliance thereon. Any statements nonfactual in nature constitute only current opinions, which are subject to change without notice.