

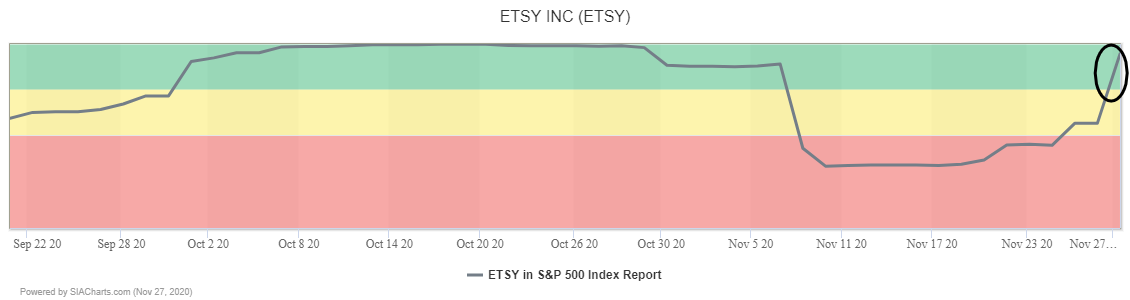
After jumping 190 spots in one day to 32nd place on the back of a 10.6% share price rally, online retailer Etsy (ETSY) has returned to the Green Favored Zone in the SIA S&P 500 Index Report from a brief dip into the red and yellow zones.
Since bottoming out in March, Etsy (ETSY) shares have been steadily recovering with a step pattern of rallies followed by periods of consolidation at higher levels indicating ongoing accumulation. In recent weeks, the shares had been consolidating between $125.00 and $150.00, but on Friday, renewed interest propelled the shares up through $150.00. This breakout to a new all-time high has signaled the start of a new rally phase.
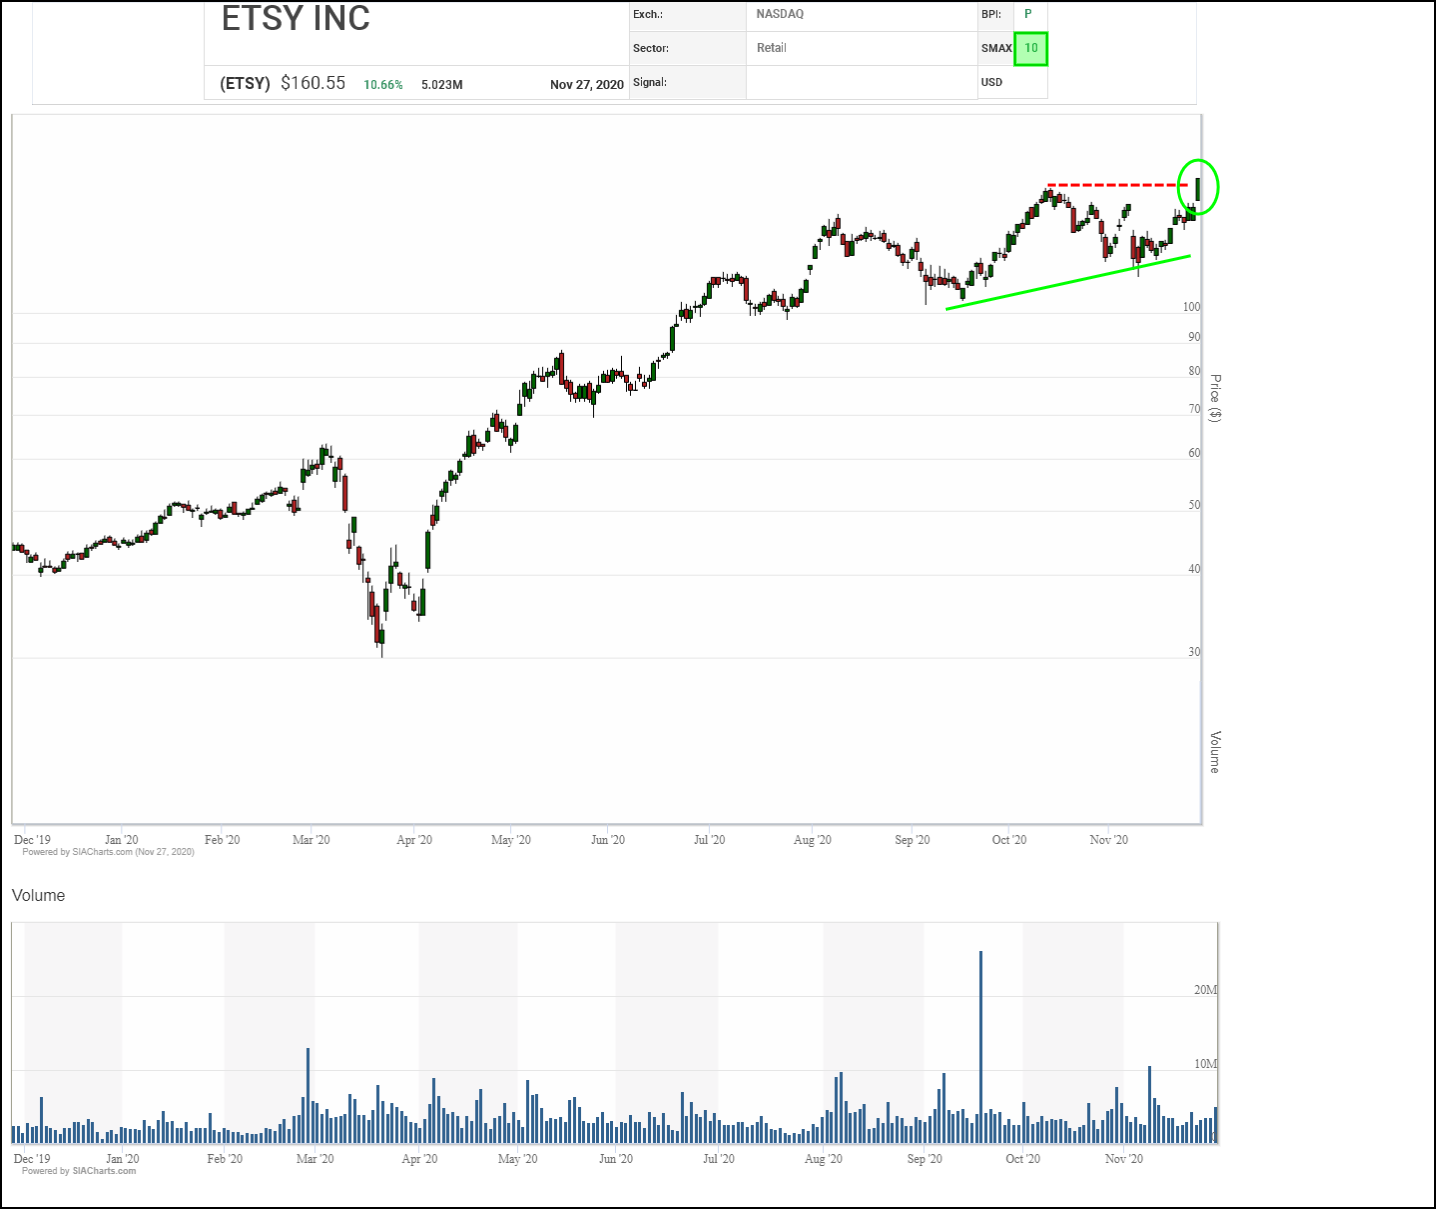
Next potential resistance on trend appears in the $175.00 to $180.00 range based on measured moves with initial support moving up to the $150.00 round number and breakout point.
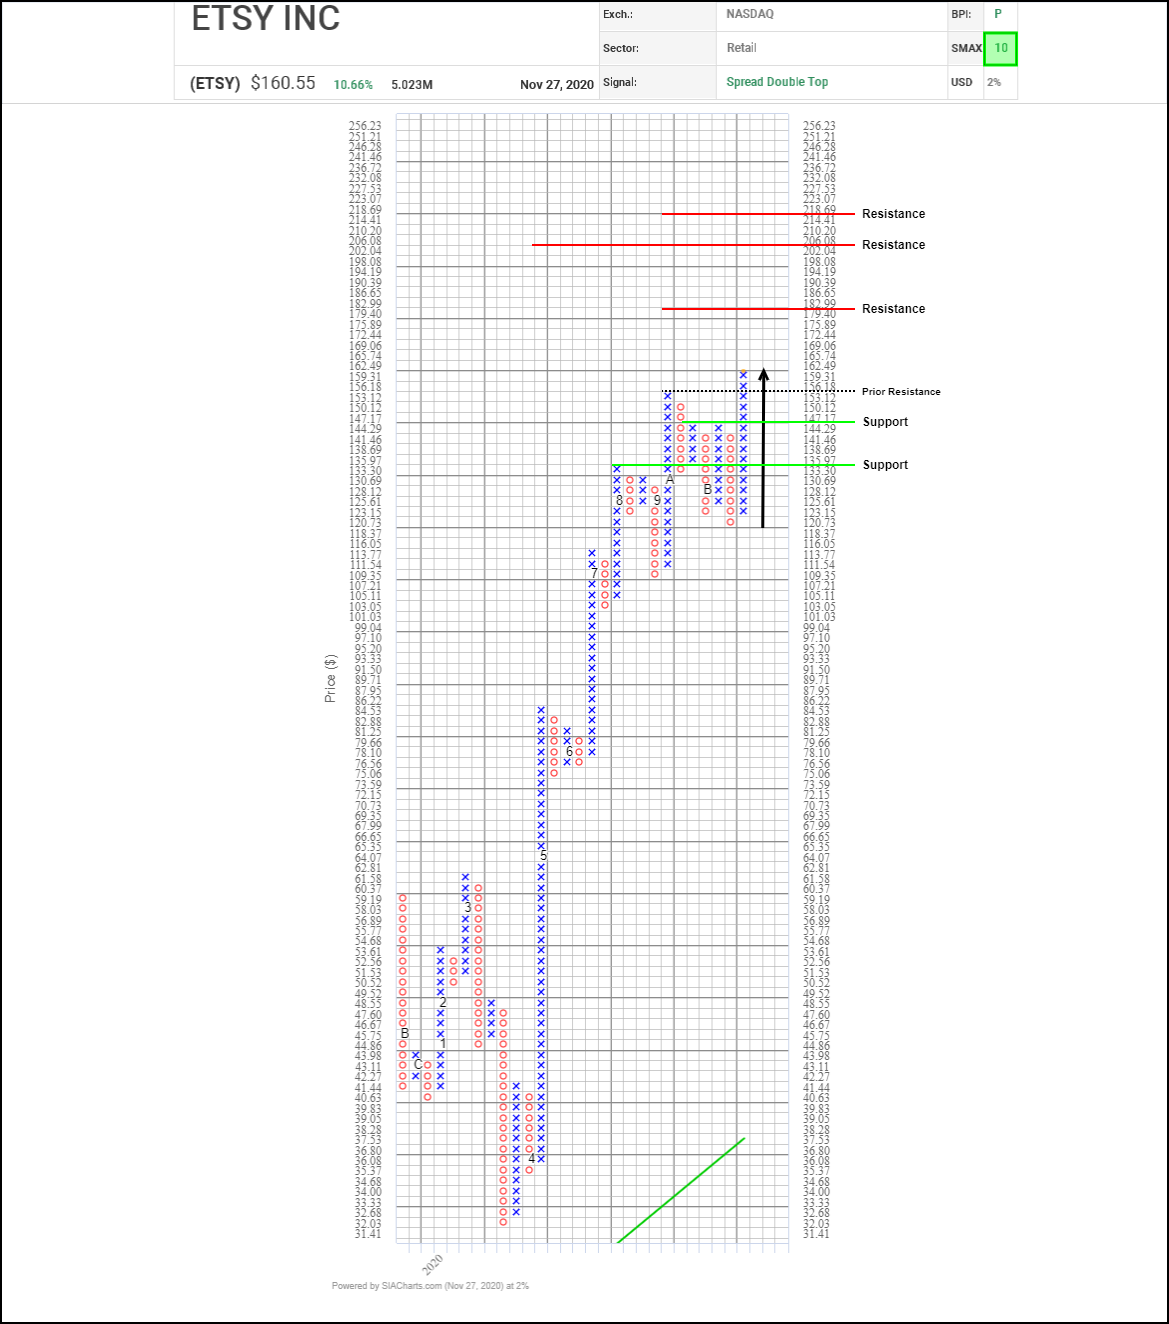
Etsy (ETSY) shares staged a major double breakout, completing both a bullish Triple Top and a larger bullish Spread Double Top on Friday, clearing both $150.00 and $160.00 on their way to a new all-time high, and signaling the start of a new upleg.
Vertical and horizontal counts suggest potential upside resistance tests on trend near $183.00, $206.10 and $218.70, with the $200.00 round number also a possible test. Initial support appears between $144.30 and $147.15 where a 3-box reversal and a retest of a breakout point converge.
With its bullish SMAX score increasing to a perfect 10, ETSY is exhibiting near-term strength across the asset classes.
Disclaimer: SIACharts Inc. specifically represents that it does not give investment advice or advocate the purchase or sale of any security or investment whatsoever. This information has been prepared without regard to any particular investors investment objectives, financial situation, and needs. None of the information contained in this document constitutes an offer to sell or the solicitation of an offer to buy any security or other investment or an offer to provide investment services of any kind. As such, advisors and their clients should not act on any recommendation (express or implied) or information in this report without obtaining specific advice in relation to their accounts and should not rely on information herein as the primary basis for their investment decisions. Information contained herein is based on data obtained from recognized statistical services, issuer reports or communications, or other sources, believed to be reliable. SIACharts Inc. nor its third party content providers make any representations or warranties or take any responsibility as to the accuracy or completeness of any recommendation or information contained herein and shall not be liable for any errors, inaccuracies or delays in content, or for any actions taken in reliance thereon. Any statements nonfactual in nature constitute only current opinions, which are subject to change without notice.