
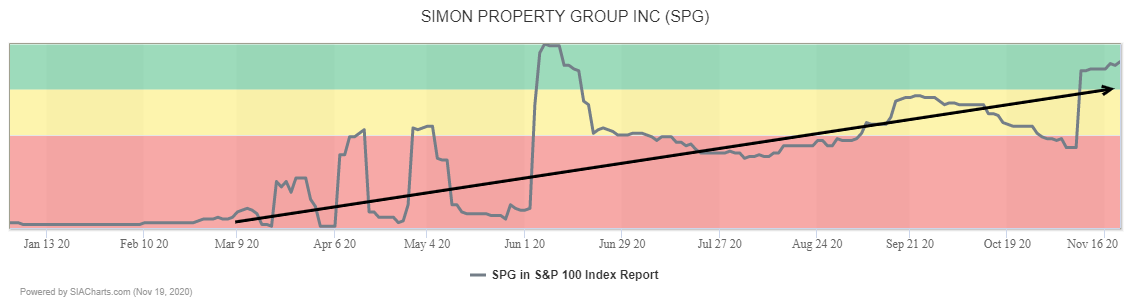
Shopping mall owner Simon Property Group continues to climb within the Green Favored Zone in the SIA S&P 100 Index Report. Yesterday it moved up another two spots to 11th place and it has climbed 36 spots in the last month.
A major breakout is underway in Simon Property Group (SPG) shares. With the exception of a brief spike in June, SPG shares spent March through October building a large Ascending Triangle base for recovery. Earlier this month, the shares broke out over $70.00 to complete the base, successfully retested that breakout point as new support and yesterday closed above $80.00, all combining to signal increased accumulation and the start of a new uptrend.
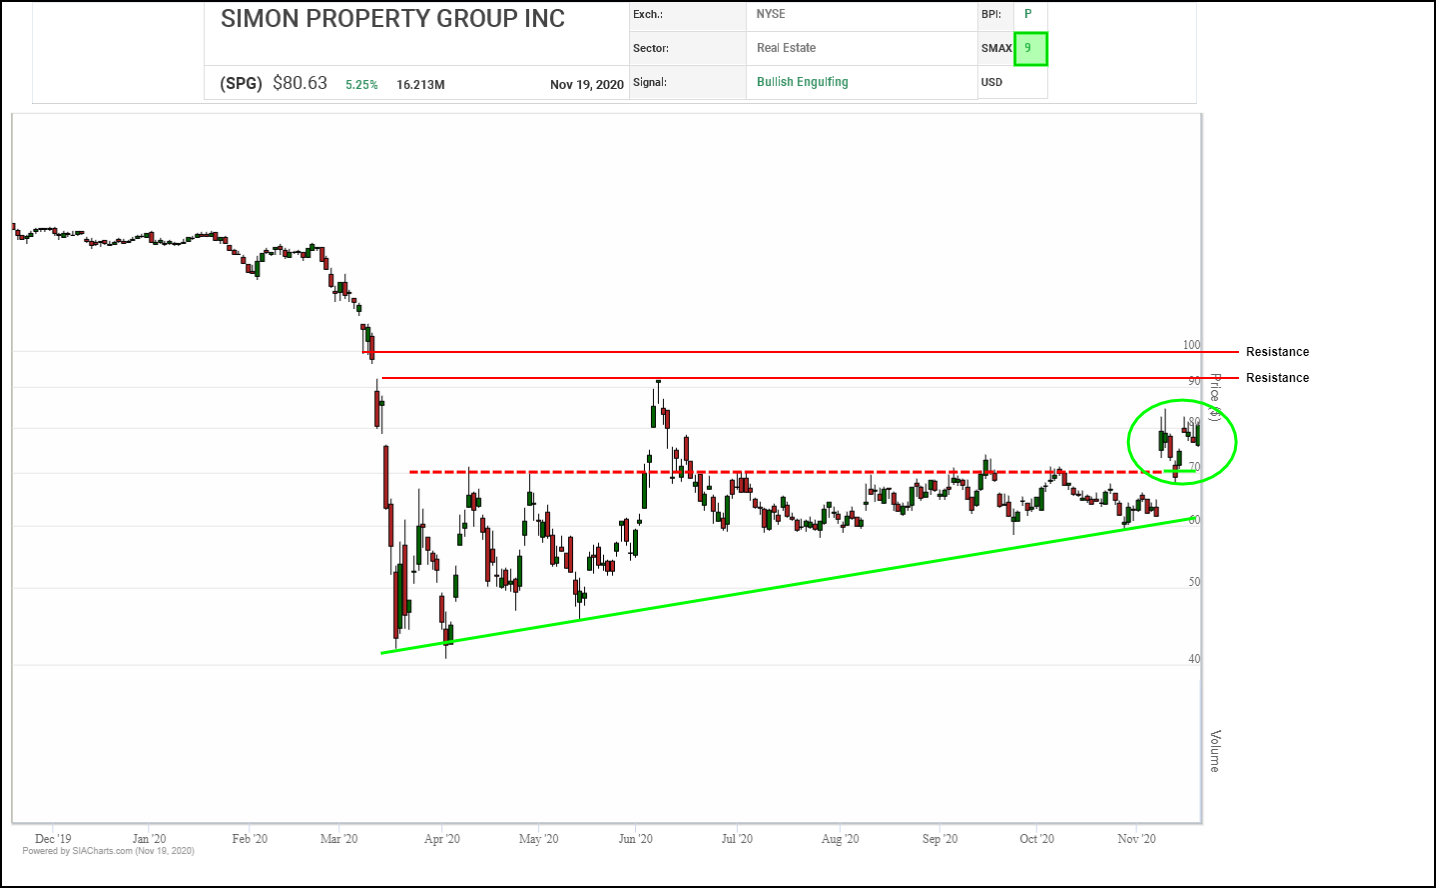
Next potential resistance appears in the $92.00 to $100.00 zone where multiple measured moves, the June high, an old gap, and a round number cluster together. Initial support moves up toward $75.00 from $70.00.
After an initial recovery rally faltered back in June, Simon Property Group (SPG) spent the summer consolidating and building a base for its next move. This month, accumulation has resumed with the shares rallying from near $60.00 toward $80.00 and completing a bullish Spread Double Top pattern followed by a bullish Double Top breakout yesterday.

Currently, the shares are bumping up against initial resistance near $81.40 where a downtrend line and a previous column low converge. A breakout over $83.00 would snap the downtrend and confirm the start of a new uptrend. Should that occur, next potential upside resistance tests may appear at the June peak near $93.50, then the $$99.50 to $101.50 zone where vertical and horizontal counts converge with the $100.00 round number. Initial support appears near $73.75 based on a 3-box reversal.
With its bullish SMAX score increasing to 9, SPG is exhibiting near-term strength against the asset classes.
Disclaimer: SIACharts Inc. specifically represents that it does not give investment advice or advocate the purchase or sale of any security or investment whatsoever. This information has been prepared without regard to any particular investors investment objectives, financial situation, and needs. None of the information contained in this document constitutes an offer to sell or the solicitation of an offer to buy any security or other investment or an offer to provide investment services of any kind. As such, advisors and their clients should not act on any recommendation (express or implied) or information in this report without obtaining specific advice in relation to their accounts and should not rely on information herein as the primary basis for their investment decisions. Information contained herein is based on data obtained from recognized statistical services, issuer reports or communications, or other sources, believed to be reliable. SIACharts Inc. nor its third party content providers make any representations or warranties or take any responsibility as to the accuracy or completeness of any recommendation or information contained herein and shall not be liable for any errors, inaccuracies or delays in content, or for any actions taken in reliance thereon. Any statements nonfactual in nature constitute only current opinions, which are subject to change without notice.