


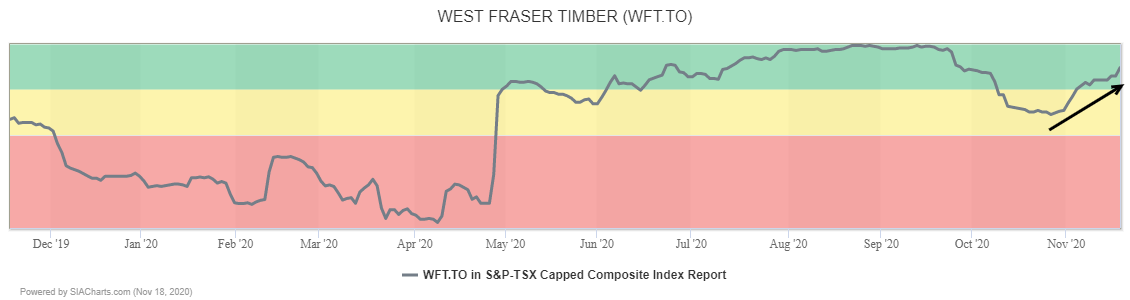
West Fraser Timber recently returned to the Green Favored Zone in the SIA S&P/TSX Composite Index Report and continues to climb up the rankings. Yesterday it moved up another 10 spots to 31st place and it is up 51 spots in the last month.
West Fraser Timber (WFT.TO) shares currently find themselves stuck in a trading range between $60.00 and $75.00, two levels which have been significant technically over the last three years, reversing polarity between resistance and support. Coming off of a strong six-month rally that saw the shares snap out of a long-term downtrend, recent trading appears to be a normal consolidation within an emerging upward trend.

A breakout over $75.00 would signal the start of a new upleg with next potential resistance in the $90.00 to $100.00 range which includes the 3-year high near $92.50, a measured $95.00 and the $100.00 round number. Initial support currently appears near $65.00.

Over the summer, West Fraser Timber (WFT.TO) staged a strong advance, creating a pole by rallying from near $40.00 toward $75.00 without even a three-box correction, and decisively snapping out of a long-term downtrend. Since September, the shares have been consolidating between $60.00 and $75.00. In recent weeks, accumulation appears to have resumed with the shares climbing within that range, but it still needs to break out over $75.00 to signal the start of a new upleg.
Should that occur, next potential resistance may appear at a previous column high near $77.95, then $89.50 and $95.00 on trend where horizontal counts and previous column highs converge. Initial support appears near $66.50 based on a 3-box reversal.
With a perfect SMAX score of 10, WFT.TO is exhibiting near-term strength across the asset classes.
Disclaimer: SIACharts Inc. specifically represents that it does not give investment advice or advocate the purchase or sale of any security or investment whatsoever. This information has been prepared without regard to any particular investors investment objectives, financial situation, and needs. None of the information contained in this document constitutes an offer to sell or the solicitation of an offer to buy any security or other investment or an offer to provide investment services of any kind. As such, advisors and their clients should not act on any recommendation (express or implied) or information in this report without obtaining specific advice in relation to their accounts and should not rely on information herein as the primary basis for their investment decisions. Information contained herein is based on data obtained from recognized statistical services, issuer reports or communications, or other sources, believed to be reliable. SIACharts Inc. nor its third party content providers make any representations or warranties or take any responsibility as to the accuracy or completeness of any recommendation or information contained herein and shall not be liable for any errors, inaccuracies or delays in content, or for any actions taken in reliance thereon. Any statements nonfactual in nature constitute only current opinions, which are subject to change without notice.