
by Jurrien Timmer, Director of Global Macro, Fidelity Investments
Key takeaways
- The makeup of the Senate won't be decided until January. After the run-off elections for the Georgia Senate seats, we'll have a better idea about the level of fiscal support the economy could see.
- Stock valuations are still somewhat elevated but improving earnings may help resolve the difference between stock prices and fundamentals.
- Valuations are high partly due to liquidity provided by fiscal and monetary stimulus—without more fiscal support, valuations could come under pressure.
- But earnings have improved a lot recently—which makes sense given the improvement in the economy. Policy response, the path of the coronavirus, and the timing of a vaccine may dictate the pace of the rest of the recovery.
Well, the election certainly turned out to be a nail-biter. While the recounts and legal challenges are only now beginning, I, for one, am looking forward to spending a little bit less of my time focused on it.
Pending the outcome of recounts and legal challenges underway, it now appears we will have a Democrat in the White House, while control of the Senate awaits the results of 2 Georgia run-offs in early January.
The chart below shows the stock market’s annualized return during the first 2 years of the presidential cycle. On the left are all cycles, in the middle are the sweeps (red or blue), and on the right are periods of divided government. For the Democrats, divided governments have been few and far between, but the last 2 produced outstanding results for the market.
On to the economy and markets
With control of the Senate unresolved, we won’t know until January the likelihood of seeing a fiscal/monetary cocktail of the size and scope the market has appeared to be primed for. If we get less experimentation with the lite version of Modern Monetary Theory* (MMT), for which 2020 began the slippery slope, that raises questions about the narrative of a possible secular rotation from growth to value and from large caps to small caps and from financial assets to real assets. In my view, that narrative requires structural inflation (created by a lasting surge in the money supply), which may or may not be on the way.
For the inflation narrative to work we will need both barrels of the fiscal/monetary policy weapon to fire at the same time. If it’s only the monetary side then we risk repeating the experience of the post-global financial crisis (GFC) period, during which a wave of fiscal austerity offset some of the Fed’s monetary accommodation. Regardless which party ends up with control of the Senate, I still expect some sort of fiscal spending wave complemented by monetary accommodation (perhaps limited to COVID relief and infrastructure); however, we may see somewhat less with a GOP majority than with a Democratic majority.
Ultimately, in order for inflation to appear, people will need to be willing (and able) to spend their dollars more rapidly, thus bringing up the velocity of money, the rate at which money is exchanged or spent. Until then, I expect interest rates to remain very low.
Velocity of MZM money has been fitted to 10-year Treasury yield. MZM is the broadest measure of the money supply, including all money that is available. It includes circulating bills and coins, checking and savings deposits, and money market funds, among other things. Quarterly data as of 11/08/2020. Source: FMRCo, Haver Analytics.
None of this is to say that we can’t or won’t get the rotation from growth to value, but from what I am seeing it would not be driven by a bursting growth bubble. Bubbles are always about valuation, and I don’t see one in the Nifty Fifty (the top 50 stocks in the S&P 500).
In my view, an increase in monetary velocity could happen if the pendulum swings from capital to labor. I’m not sure yet about the path to that outcome if we end up with a divided government, but the chart below indicates that the tide is indeed turning.
Stock market and earnings
In recent days the stock market has ripped higher, the dollar has fallen to a new low, and gold and bitcoin are breaking out. A very reflationary combination.
The NASDAQ exploded higher last week. With lower odds of a big fiscal wave, the possibility of less regulatory risk for the tech industry and perhaps also less pressure to restrict share buybacks, the big free cash flow (FCF) growers have perked up again and could well continue their epic run.
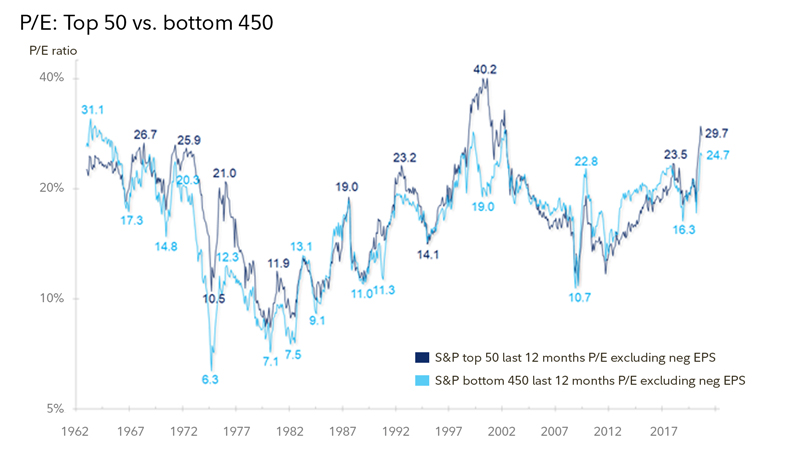
Indeed, as I pointed out last week, the Nifty Fifty (the top 50 stocks in the S&P 500) are currently only 5 points more expensive than the bottom 450 (30x vs. 25x). That’s a far cry from the heady days of the tech bubble when the spread was 21 points (40x vs. 19x). So perhaps there is still life left for the secular growers.
While stock valuations remain above average, they have improved somewhat in recent weeks as the S&P 500 (SPX) has settled into a trading range while earnings estimates keep improving.
However, if we do not end up getting a big fiscal impulse, I would expect price to earnings (P/E) multiples to come under some pressure. Changes in valuation are clearly (in part) related to excess liquidity. Perhaps valuations will come down to earth in a benign way, as earnings catch up to price.
Indeed, Q3 earnings season continues to blow the doors off:
- The year-over-year (YOY) growth rate has improved from −21% (at the start of earnings season) to −9% as of last Friday.
- The next 12 months (N12M) earnings per share (EPS) estimate has now improved to $158, vs. the last 12 months (L12M) realized EPS of $135.
The earnings improvement makes perfect sense given the improvement in the general economy. There has been an impressive rebound in the output gap (actual GDP growth minus potential growth). From +1.2% in Q1 to −9.8% in Q2 to −3.5% in Q3.
The history of market turning points shows that price typically bottoms well before earnings. Back in 2009 at the GFC low, earnings growth bottomed at −30% (year-over-year) while valuation was up 75%. This time around, earnings growth is at −16% while the YOY change in the P/E is +35% (YOY). It’s the same story, and we should now be at the point where an earnings recovery “bails out” the increase in valuation.
From my perch, the big question continues to be what the remaining track of this recovery will look like. If the economy went from 100% pre-COVID to say 10% during the lockdown and is now back to 70%, how long will it take to get back to 100% and how lumpy will that ride be?
That question depends on the track of COVID, (with a big wave now underway in Europe and the US), the timing and availability of vaccines, and, of course, the policy response.
Copyright © Fidelity Investments