
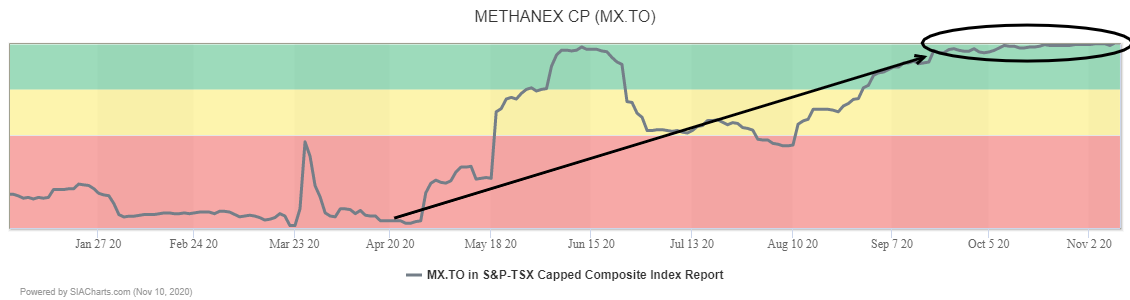
Methanex* (MX.TO) remains in first place at the top of the Green Favored Zone in the SIA S&P/TSX Composite Index Report.
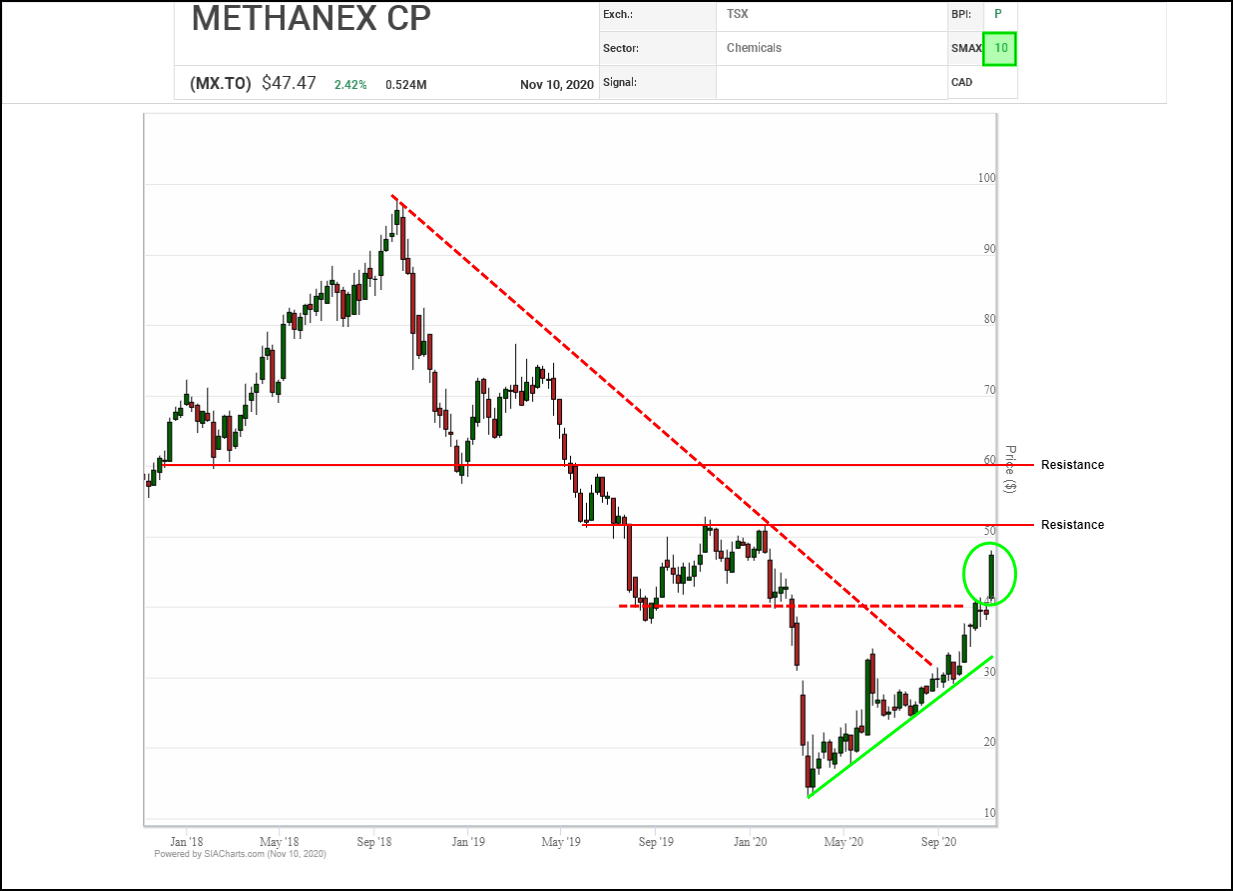
A major breakout is underway in Methanex (MX.TO) shares which blasted through $40.00 yesterday to confirm increasing accumulation and that a new upleg has started within an emerging recovery trend. Initial resistance appears in the $50.00 to $52.50 area near a round number and previous support/resistance points, followed by previous lows near the $60.00 level. Initial support moves up to the $40.00 breakout point.
*Methanex is held in some portfolios managed by SIA Wealth Management
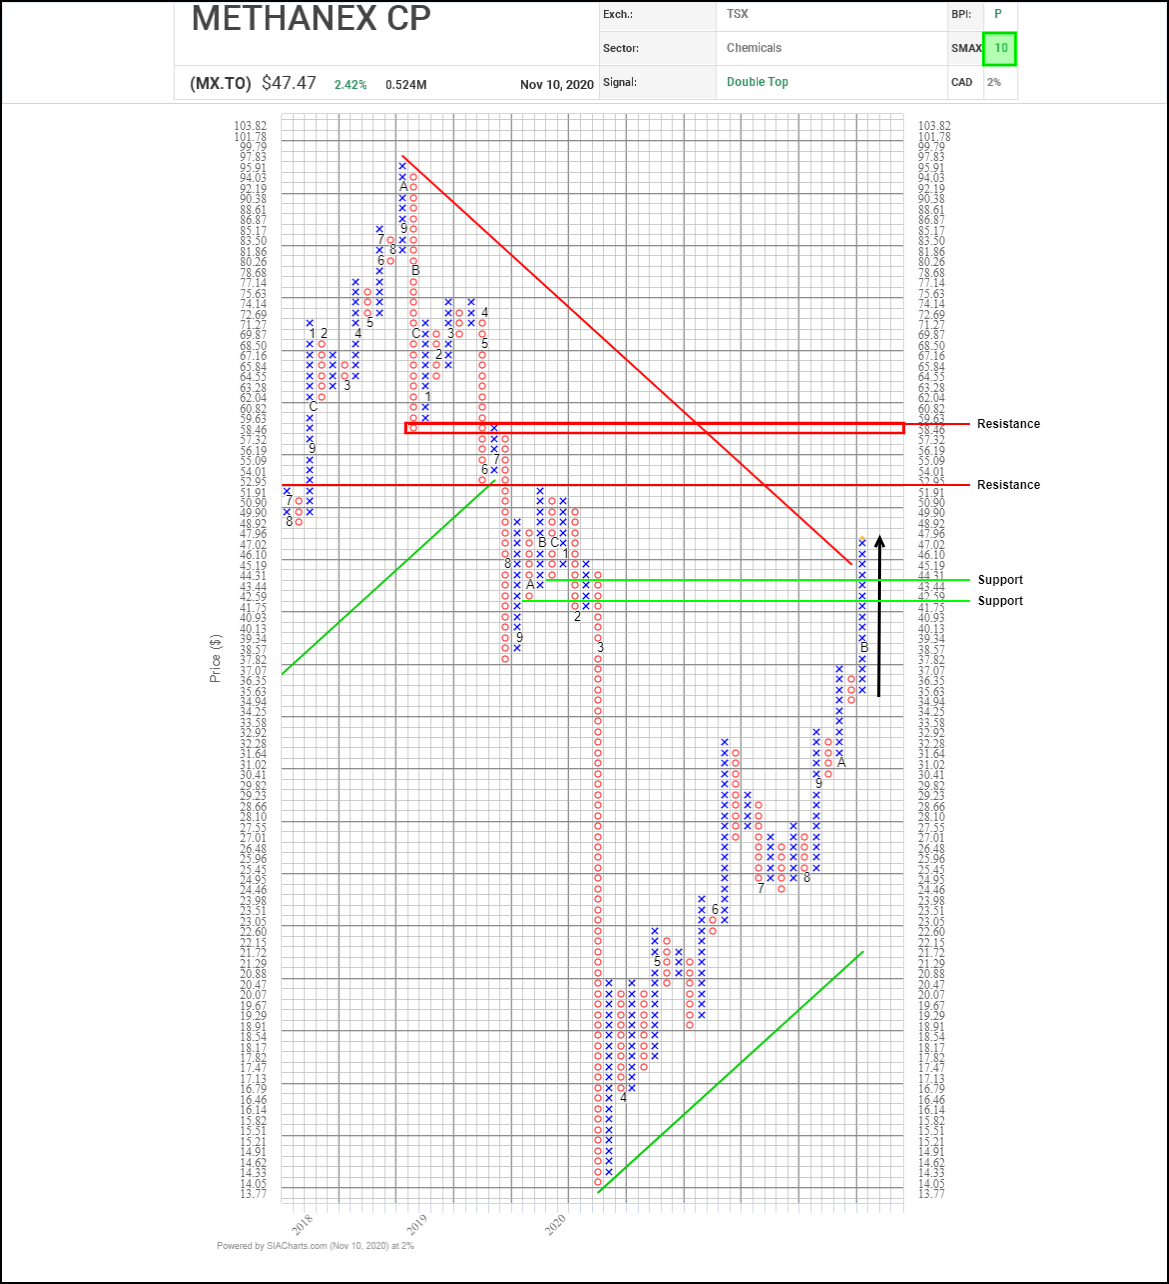
The recovery trend in Methanex* (MX.TO) shares has accelerated this month with the shares snapping a long-term downtrend line to build on a recent bullish Double Top breakout. Next potential upside resistance appears near the $50.00 round number, then previous support/resistance near $52.95, followed by the $58.45 to $59.65 zone where horizontal and vertical resistance converges with previous column highs and lows. Initial support appears near $43.45 based on a 3-box reversal.
With a perfect SMAX score of 10, MX.TO is exhibiting near-term strength across the asset classes.
*Methanex is held in some portfolios managed by SIA Wealth Management
Disclaimer: SIACharts Inc. specifically represents that it does not give investment advice or advocate the purchase or sale of any security or investment whatsoever. This information has been prepared without regard to any particular investors investment objectives, financial situation, and needs. None of the information contained in this document constitutes an offer to sell or the solicitation of an offer to buy any security or other investment or an offer to provide investment services of any kind. As such, advisors and their clients should not act on any recommendation (express or implied) or information in this report without obtaining specific advice in relation to their accounts and should not rely on information herein as the primary basis for their investment decisions. Information contained herein is based on data obtained from recognized statistical services, issuer reports or communications, or other sources, believed to be reliable. SIACharts Inc. nor its third party content providers make any representations or warranties or take any responsibility as to the accuracy or completeness of any recommendation or information contained herein and shall not be liable for any errors, inaccuracies or delays in content, or for any actions taken in reliance thereon. Any statements nonfactual in nature constitute only current opinions, which are subject to change without notice.