


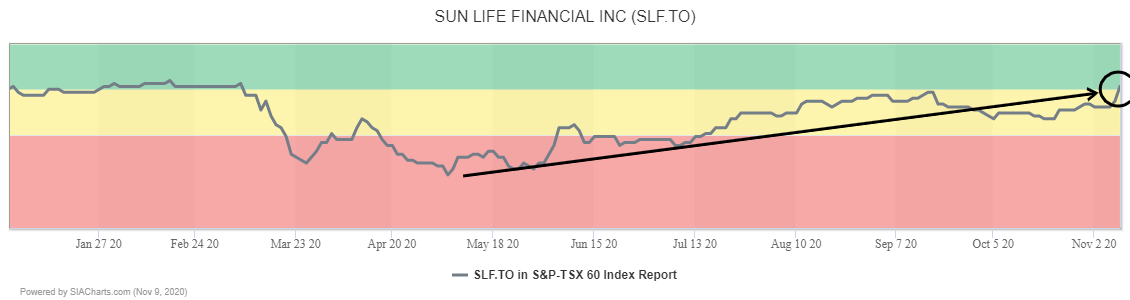
With a gain of 5 spots yesterday, insurer Sun Life Financial (SLF.TO) has returned to the Green Favored Zone of the SIA S&P/TSX 60 Index report for the first time since February.
From March through August, Sun Life Financial (SLF.TO) shares steadily recovered from the winter market crash, establishing an upward trend of consistently higher lows and completing two bullish Ascending Triangle patterns. For the last three months, the shares had been trending sideways in a normal consolidation phase. Yesterday’s breakout over $52.50 resolves the channel to the upside and signals that accumulation has resumed and a new advance has started.
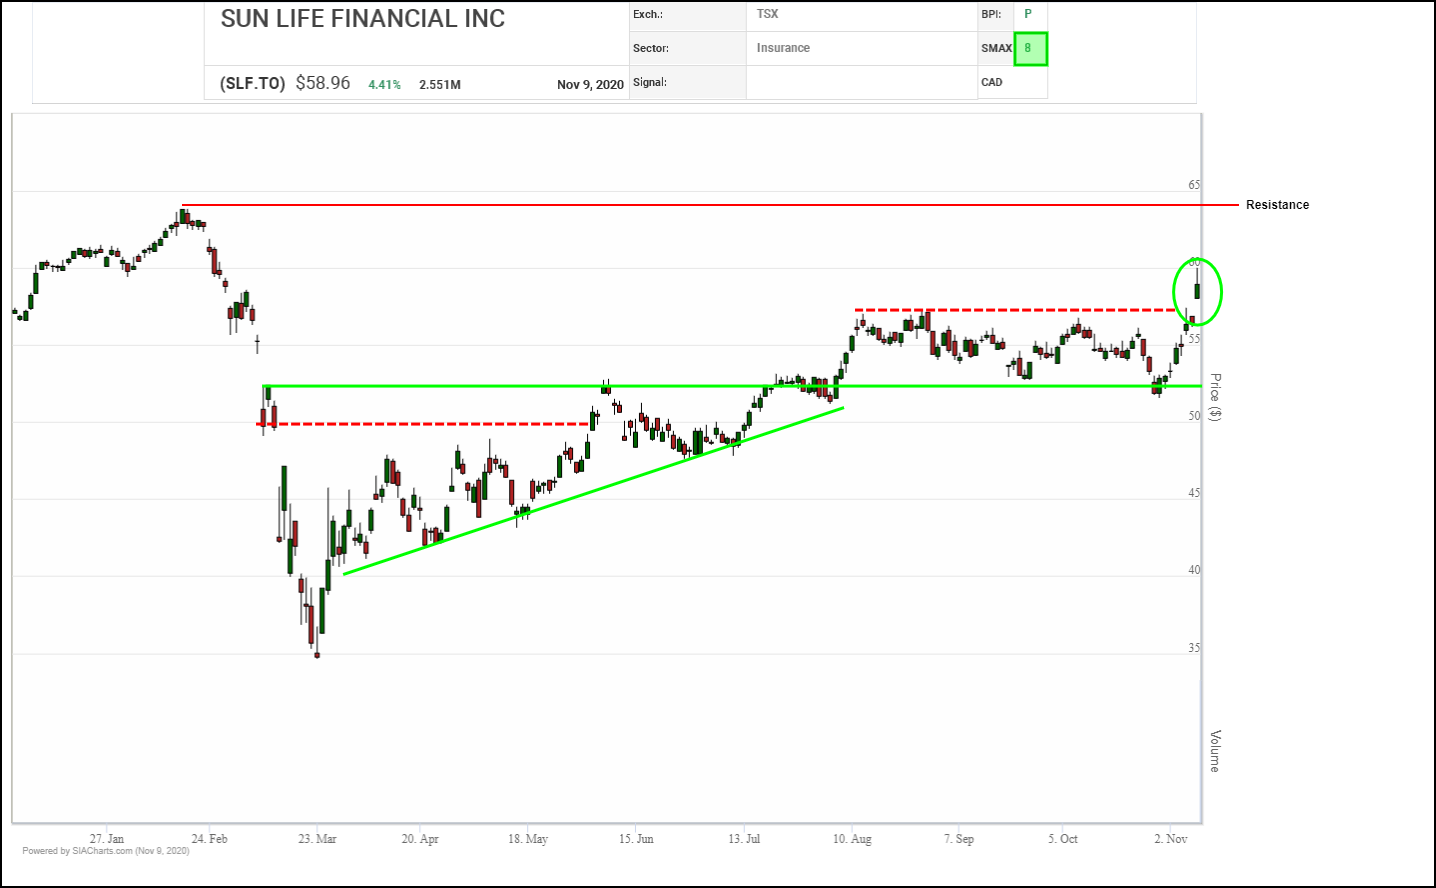
Initial resistance may appear near $60.00 a previous support level, then the previous peak near $64.00. After that, upside tests on trend may appear near $65,00 and $70.00 based on measured moves, plus the $75.00 round number. Initial support appears near the $57.50 breakout point, then $52.50.
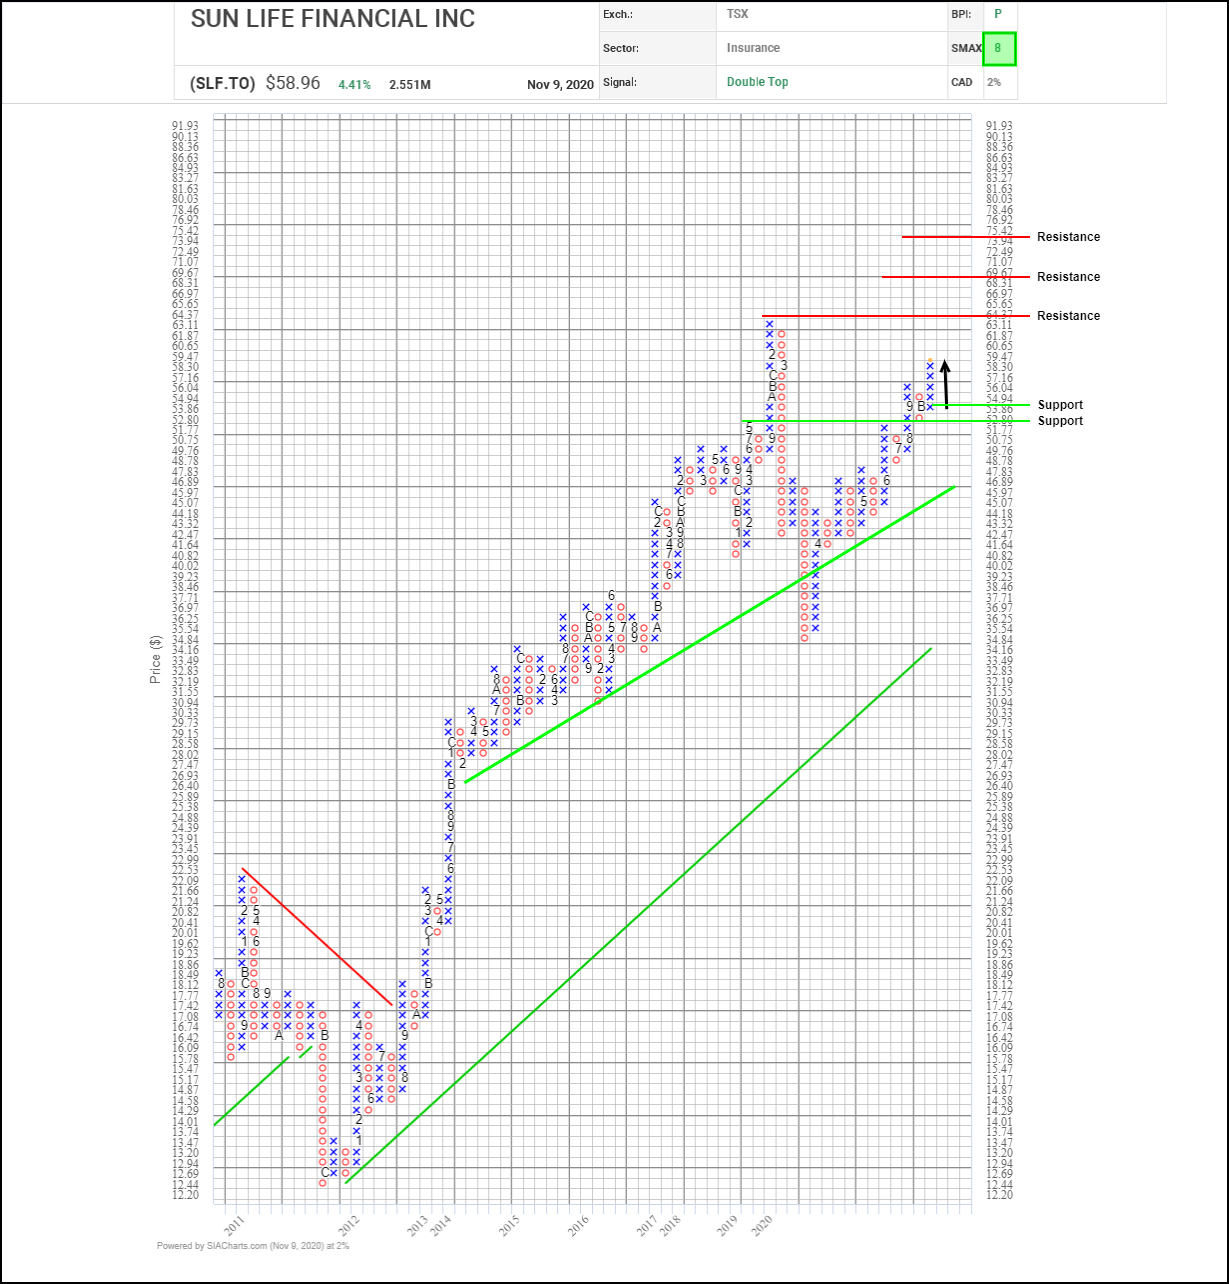
This long-term chart in Sun Life Financial (SLF.TO) shares shows how following a big upward spike in late 2019 and an even bigger downward crash in early 2020, the shares have resumed their primary upward trend, which has been in place since 2012, with a series of bullish Double Top breakouts, including one yesterday.
Next potential upside resistance appears at the previous high near $64.35, then $69.65 and $74.35 based on horizontal counts. Initial support appears near $53.90 based on a 3-box reversal.
With a bullish SMAX score of 8, SLF.TO is exhibiting near-term strength against the asset classes.
Disclaimer: SIACharts Inc. specifically represents that it does not give investment advice or advocate the purchase or sale of any security or investment whatsoever. This information has been prepared without regard to any particular investors investment objectives, financial situation, and needs. None of the information contained in this document constitutes an offer to sell or the solicitation of an offer to buy any security or other investment or an offer to provide investment services of any kind. As such, advisors and their clients should not act on any recommendation (express or implied) or information in this report without obtaining specific advice in relation to their accounts and should not rely on information herein as the primary basis for their investment decisions. Information contained herein is based on data obtained from recognized statistical services, issuer reports or communications, or other sources, believed to be reliable. SIACharts Inc. nor its third party content providers make any representations or warranties or take any responsibility as to the accuracy or completeness of any recommendation or information contained herein and shall not be liable for any errors, inaccuracies or delays in content, or for any actions taken in reliance thereon. Any statements nonfactual in nature constitute only current opinions, which are subject to change without notice.