


Since we last mentioned Lightspeed POS* (LSPD.TO) in the July 3rd issue of the Daily Stock Report, the shares have climbed 43.0%. Yesterday it continued its recent move up within the Green Favored Zone of the SIA S&P/TSX Composite Index report, climbing 22 spots to 4th place.
While Lightspeed POS* (LSPD) shares have been under renewed accumulation since March, their upward trend has now clearly accelerated. A number of bullish indicators aligned yesterday to signal increased investor interest and the start of a new advance including: breakouts over both $45.00 and $50.00, a breakaway gap to the upside, and a rally to a new all-time high, all occurring on a spike in volume.
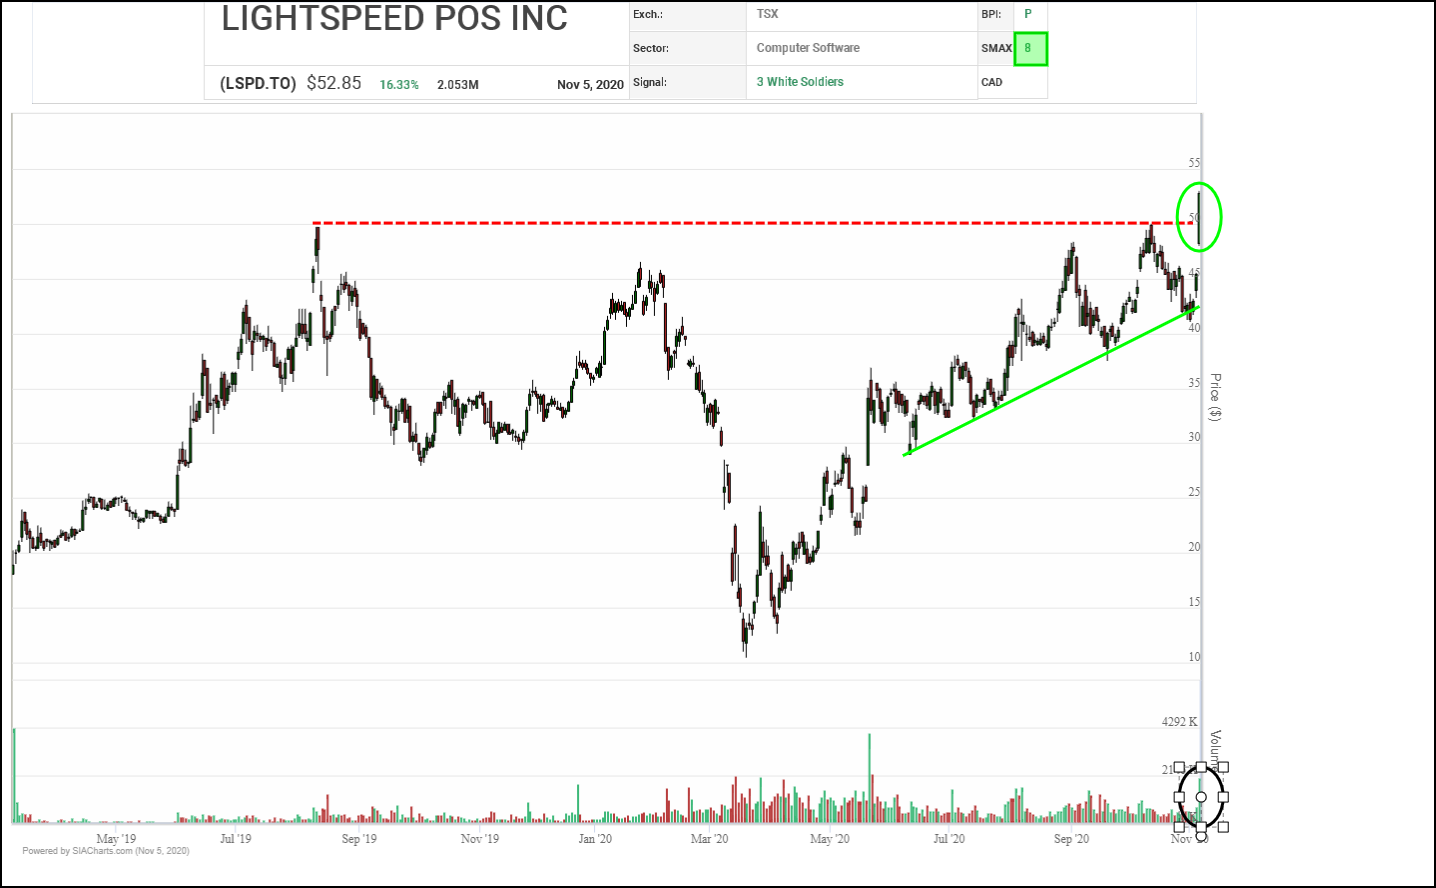
Measured moves suggest next potential upside resistance tests on trend may appear near $60.00, $62.50, or $70.00. Initial support moves up to the $50.00 breakout point, then the top of the gap near $48.00.
*Shares of Lightspeed POS are held in portfolios managed by SIA Wealth Management.
Lightspeed POS* (LSPD.TO) staged a major breakout yesterday, not only completing a bullish Double Top pattern but also clearing its August 2019 previous peak to trade at a new high, and confirming the start of a new upleg by clearing the $50.00 round number hurdle.
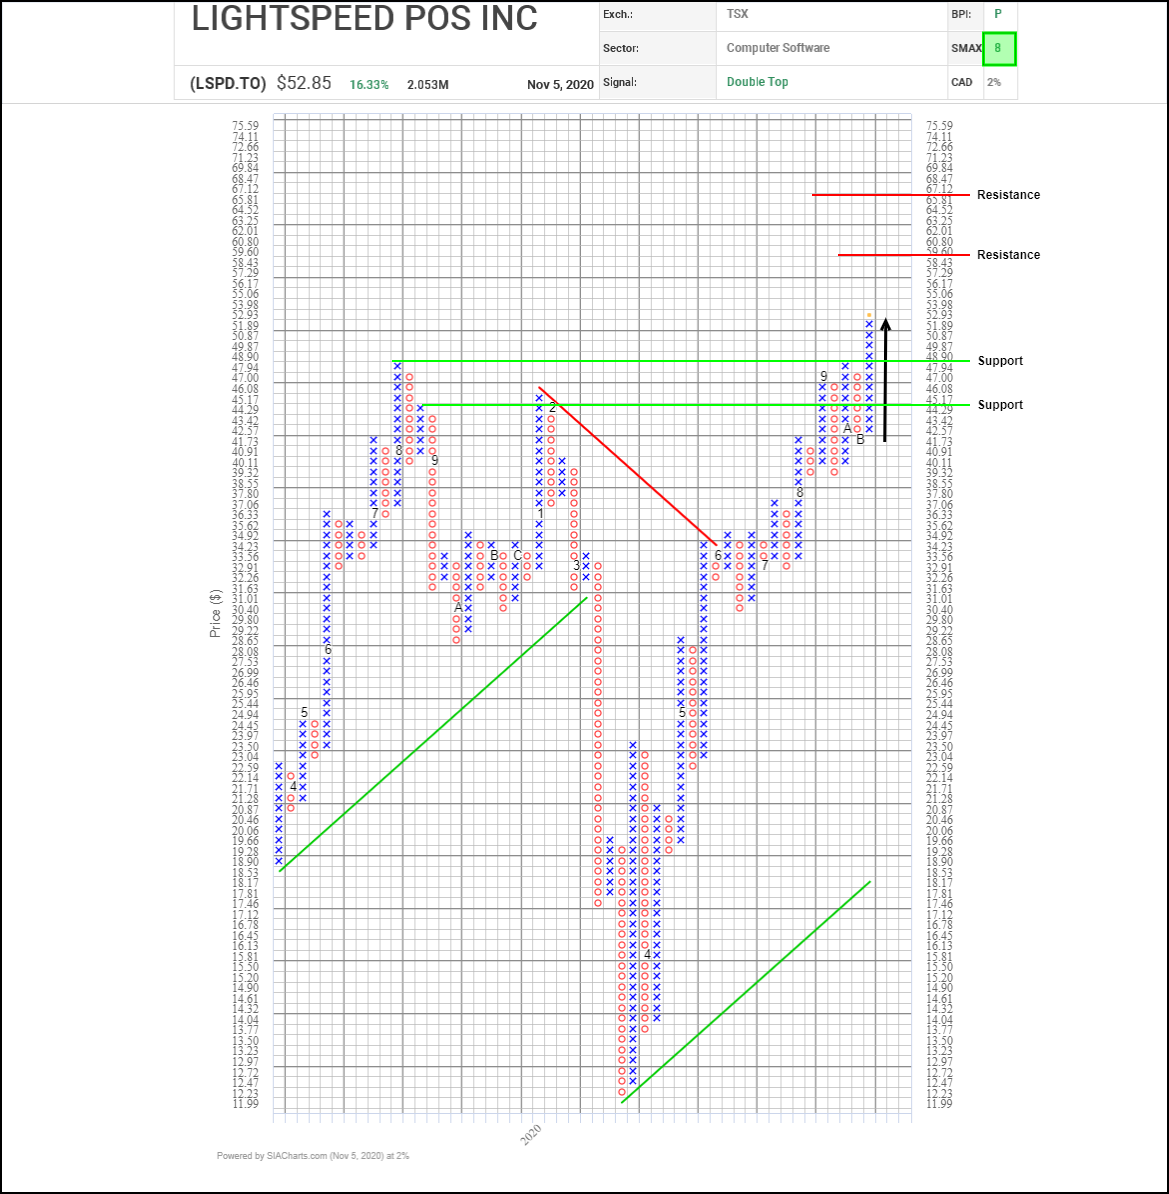
Next potential upside resistance appears near $59.60, then $67.15 based on vertical and horizontal counts. Initial support appears near $47.95 based on a 3-box reversal and a retest of the recent breakout point.
With a bullish SMAX score of 8, LSPD.TO is exhibiting near-term strength against the asset classes.
*Shares of Lightspeed POS are held in portfolios managed by SIA Wealth Management.
Disclaimer: SIACharts Inc. specifically represents that it does not give investment advice or advocate the purchase or sale of any security or investment whatsoever. This information has been prepared without regard to any particular investors investment objectives, financial situation, and needs. None of the information contained in this document constitutes an offer to sell or the solicitation of an offer to buy any security or other investment or an offer to provide investment services of any kind. As such, advisors and their clients should not act on any recommendation (express or implied) or information in this report without obtaining specific advice in relation to their accounts and should not rely on information herein as the primary basis for their investment decisions. Information contained herein is based on data obtained from recognized statistical services, issuer reports or communications, or other sources, believed to be reliable. SIACharts Inc. nor its third party content providers make any representations or warranties or take any responsibility as to the accuracy or completeness of any recommendation or information contained herein and shall not be liable for any errors, inaccuracies or delays in content, or for any actions taken in reliance thereon. Any statements nonfactual in nature constitute only current opinions, which are subject to change without notice.