
The election is center stage now but the economic recovery may need attention soon.
by Jurrien Timmer, Director of Global Macro, Fidelity Investments
Key takeaways
- The economy has recovered sharply since the spring but is unlikely to get back to 100% until there is a vaccine for COVID-19. Until then, further fiscal relief will be needed.
- That stimulus may come right after the election, or after the inauguration in January. Either way, it will likely be supported by ongoing central bank accommodation, much like occurred during the 1940s when the US ran up large deficits which were absorbed by the Fed.
- Stocks have been tempering their optimism in recent weeks as stimulus expectations have been repriced amid rising COVID cases. But fundamentals have improved as Q3 earnings reports have come in much stronger than expected.
- The top 50 stocks (the Nifty Fifty) continue to dwarf the bottom 450 but their outperformance has been fully justified by earnings growth. Bubbles are always about valuation, and I still don’t see a bubble in growth stocks.
After a few weeks of relative calm, the markets have been under pressure again. First and foremost, is the renewed rise in reported COVID cases in Europe and parts of the US. Rising positivity and hospitalization rates have prompted several European countries to go back into some form of lockdown, with fears that the same might happen in the US.
Renewed restrictions in the US, should they happen, could delay a further reopening of the economy and necessitate further fiscal relief from Washington. But after weeks of negotiations between the White House and Congress, the window for a pre-election fiscal bill has closed. This has been a tough combination for the markets.
The way I think of this cycle is that the economy went from full capacity (100%) pre-COVID to 10% during the lockdown, with many hoping that it could quickly go back to 100%. Think of it as a natural disaster but on a global scale. A quick rebound to full capacity would have limited the economic fallout to one of liquidity (which the Fed effectively mitigated in the spring) rather than insolvency (which requires extensive fiscal relief). Think of it as a policy bridge to the other side of the pandemic. Both the fiscal and monetary policy response back in the spring were timely and effective in building that bridge.
But the economy has recovered to only 70% or so, with that remaining 30% in doubt as long as COVID is present and vaccines are not yet available. The longer that 30% gap stays open, the more of an insolvency problem this could become and the more this cycle could start to look like the global financial crisis (GFC) back in 2008.
Back in 2008, the output gap (the difference between actual GDP growth and potential growth) fell from +0.2% to −6.0% and it took 7 years to close it. This time around the output gap fell from +1.2% to −9.8% in the second quarter and has since narrowed to −3.5%. That’s a strong recovery for such a short time span, but the question is how long it will take to close this remaining gap.
With COVID cases now rising again, the path to full capacity could take longer, which means that the policy bridge needs to be extended. That has not happened yet and with the election now taking center stage it is unclear when the next relief bill will be forthcoming. Hopefully, it will be shortly after the election, but there may be a risk that it will be sometime after January when the next Congress is sworn in.
In my view, the defining theme for the markets (in addition to COVID-19) is the potential for a prolonged period of fiscal expansion (i.e., deficit spending) absorbed by a highly accommodative Fed. Think of it as a lite version of Modern Monetary Theory (MMT).* As far as I can tell, the last (and only) time this monetary/fiscal policy combination was in effect was during the 1940s when the US joined World War II.
This time around, such a fiscal/monetary cocktail could happen regardless of which party is in power, as long as that party controls both houses of Congress. But with the election outcome still uncertain, the market, as revealed in recent volatility, appears to be preparing to reprice itself for the possibility of a somewhat less stimulative regime.
As for the stock market, the earnings fundamentals continue to improve, with Q3 earnings season a big success so far. With 320 companies reporting, 85% are beating estimates by an average of 17 percentage points. The Q3 growth rate has improved from −21% at the start of earnings season to −11% as of Friday.
Technically, the market is very oversold. If we manage to hold last week’s low, chances are that this 8-week period of sideways will be the pause that refreshes on the way to higher prices. But a break of the lows in the days ahead raises the possibility of a larger correction.
The Nifty Fifty, updated
Speaking of growth vs. value, last week I laid out the case for a secular rotation into value stocks and small caps. For that to happen, the surge in the money supply will have to lead to structurally higher inflation.
But before we throw in the towel on growth, here is an update on the Nifty Fifty study that I did over the summer. It compared the current market leadership to the lopsided leadership of the late 1990s and the original Nifty Fifty era of the mid-1970s. The bottom line in that article was that the spread in valuations between the top 50 stocks in the S&P 500 and the bottom 450 is notable today but nowhere close to the spread during the dot-com bubble.
Interestingly, with data now through Q3, the top 50 stocks in the S&P 500 have continued to lead in terms of return but are actually slightly cheaper now in terms of valuation. It shows the power of earnings in driving stock prices without necessarily inflating price-to-earnings (P/E) multiples.
The chart below shows that the Nifty Fifty now comprise 58% of market capitalization. That’s very close to the dot-com peak in 2000.
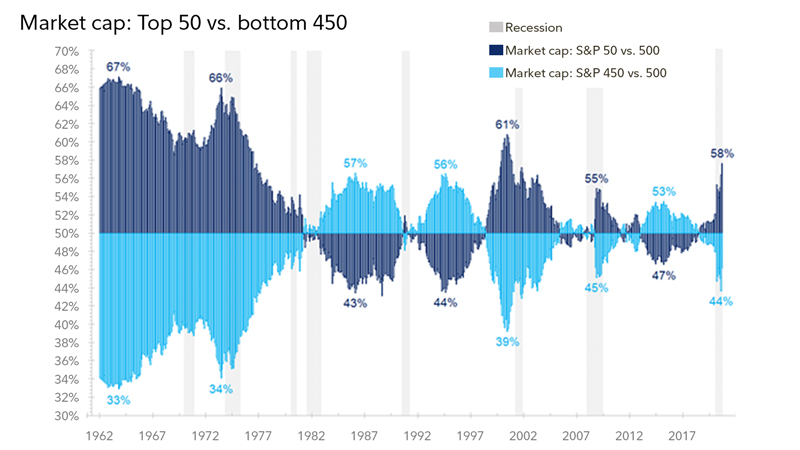
Monthly data as of 11/01/2020. Monthly rebalance is assumed. Source: FMRCo.
However, the relative performance has been entirely justified by earnings. The result is that P/E gap between the top 50 and bottom 450 has remained steady at a modest 5 points. That’s a far cry from the 21-point gap in 2000.
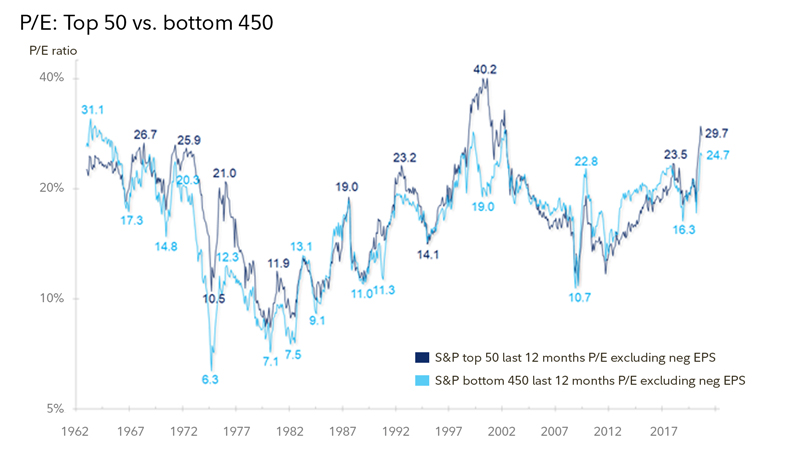
Monthly data as of 11/01/2020. Monthly rebalance is assumed. Source: FMRCo.
None of this is to say that we can’t or won’t get the rotation from growth to value, but from what I am seeing it would not be driven by a bursting growth bubble. Bubbles are always about valuation, and I don’t see one in the Nifty Fifty.
Copyright © Fidelity Investments