
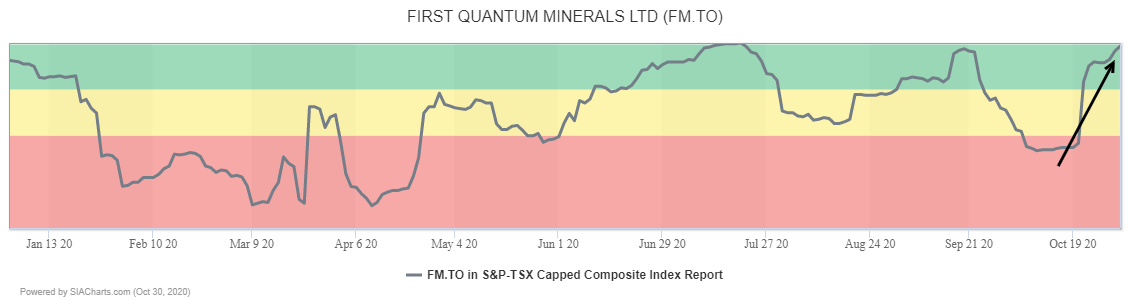
Copper producer First Quantum Minerals (FM.TO) continue to climb within the Green Favored Zone of the SIA S&P/TSX Composite Index Report. On Friday, FM.TO moved up another 6 spots to 5th place and as now moved up 102 places in the last month.
First Quantum (FM.TO) shares staged a major breakout on Friday, clearing $14.75 and $15.00 to trade at their highest level since April of 2018. This breakout confirms the summer snapping of a downtrend line and signals the start of a new upleg within a growing recovery trend.
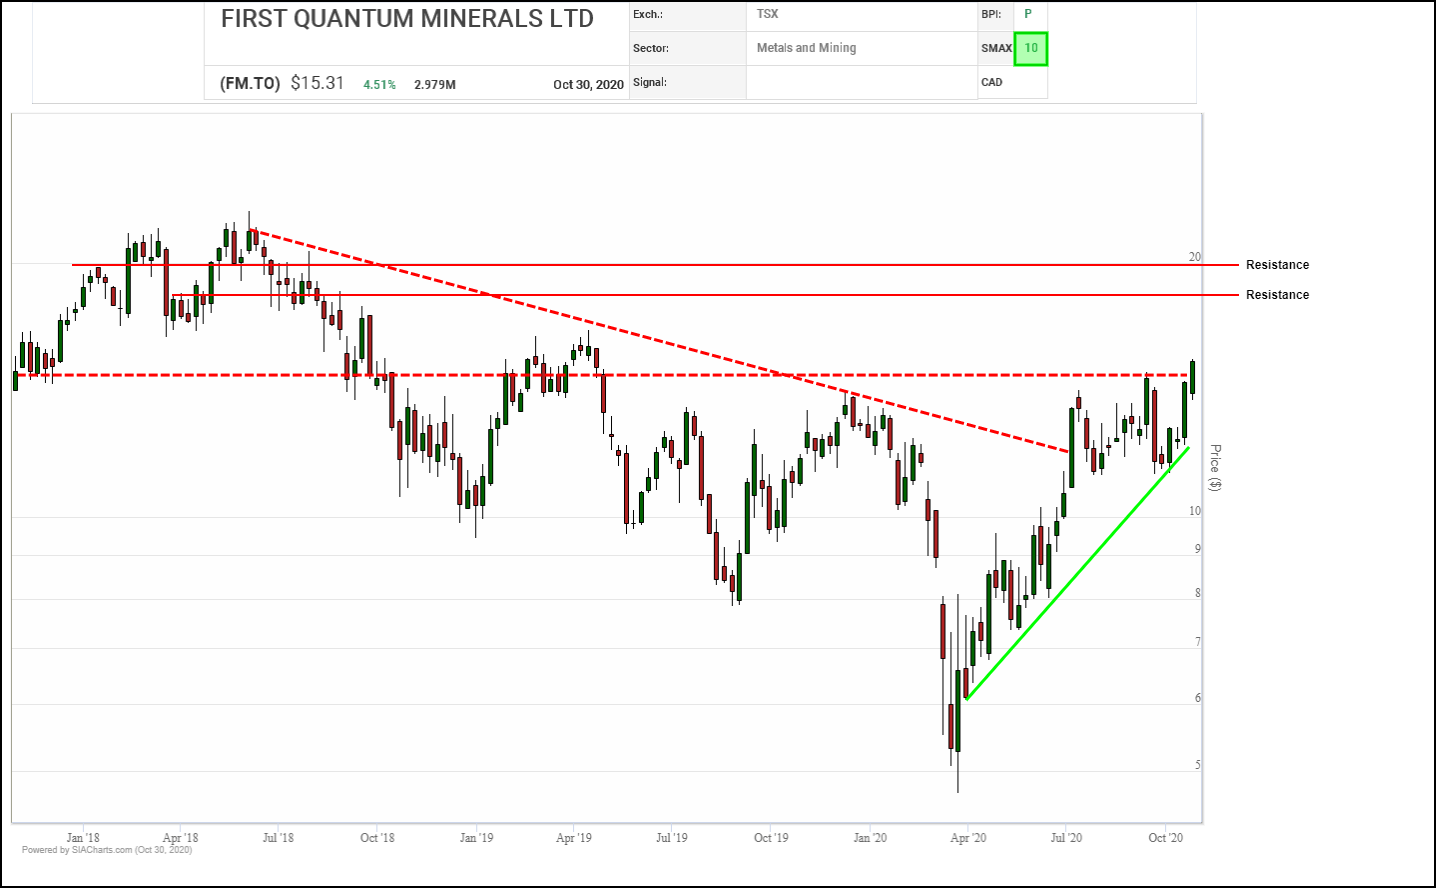
Based on a measured move up out of the recent $11.25 to $14.75 trading range, next potential resistance may appear near $18.50, followed by the $20.00 round number. Initial support appears near $13.50.
Friday’s breakout by First Quantum (FM.TO) shares continues a series of positive completions over the last few weeks which includes a bullish Triple Top, a bullish Spread Double Top and a bullish Double Top. The most breakout has confirmed that a recent correction as ended, that the shares primary uptrend has reasserted itself and that a new upleg is underway, particularly with the shares also clearing the $15.00 round number hurdle.
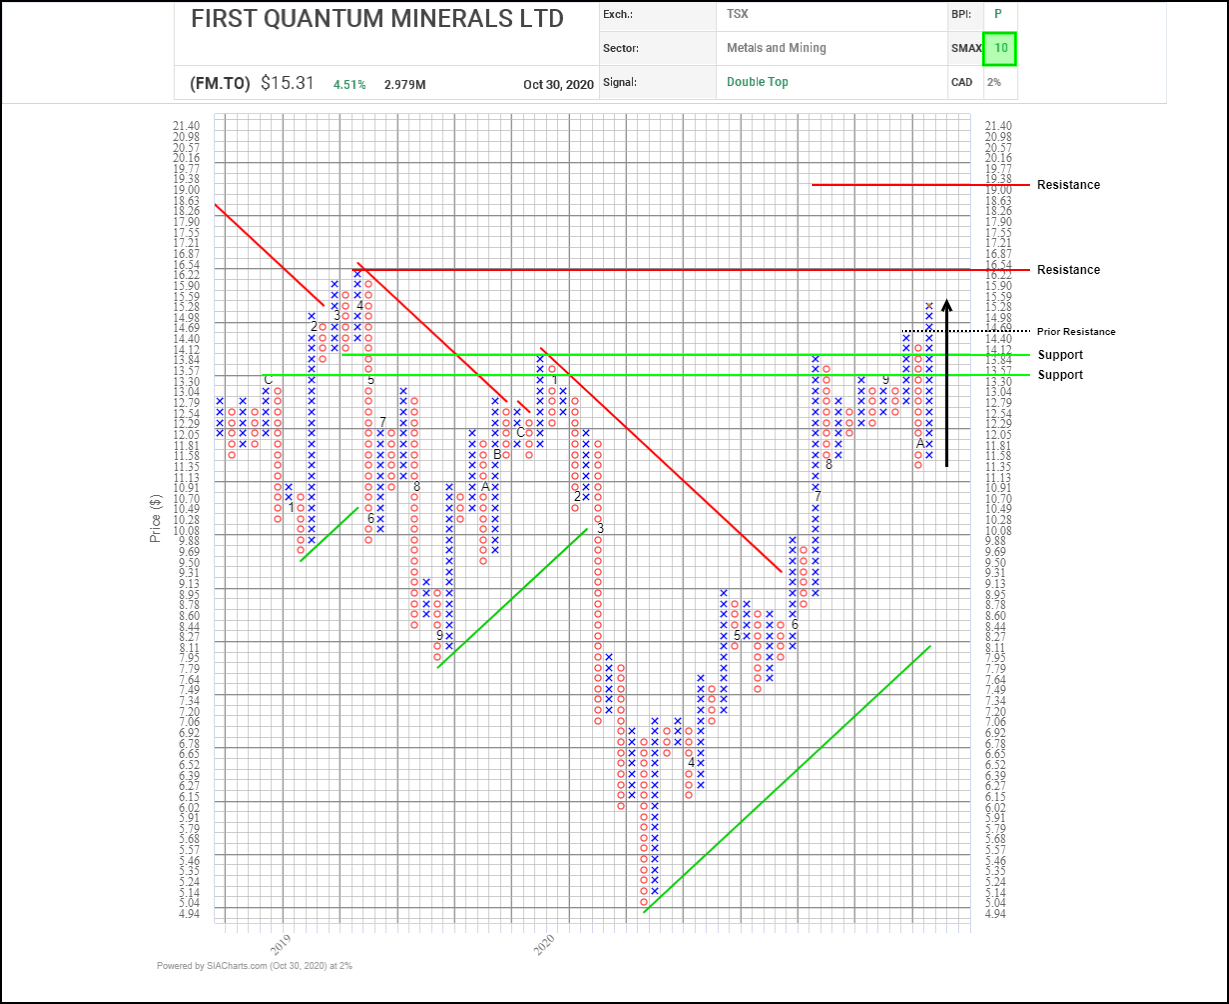
Next potential upside resistance tests on trend appear near $16.55, where a horizontal count and a previous high converge, followed by $19.40 based on a horizontal count, and then the $20.00 round number. Initial support appears in the $1330 to $13.85 zone where two recent breakout points and a 3-box reversal cluster.
With a perfect SMAX score of 10, FM.TO is exhibiting near-term strength across the asset classes.
Disclaimer: SIACharts Inc. specifically represents that it does not give investment advice or advocate the purchase or sale of any security or investment whatsoever. This information has been prepared without regard to any particular investors investment objectives, financial situation, and needs. None of the information contained in this document constitutes an offer to sell or the solicitation of an offer to buy any security or other investment or an offer to provide investment services of any kind. As such, advisors and their clients should not act on any recommendation (express or implied) or information in this report without obtaining specific advice in relation to their accounts and should not rely on information herein as the primary basis for their investment decisions. Information contained herein is based on data obtained from recognized statistical services, issuer reports or communications, or other sources, believed to be reliable. SIACharts Inc. nor its third party content providers make any representations or warranties or take any responsibility as to the accuracy or completeness of any recommendation or information contained herein and shall not be liable for any errors, inaccuracies or delays in content, or for any actions taken in reliance thereon. Any statements nonfactual in nature constitute only current opinions, which are subject to change without notice.