by Don Vialoux, EquityClock.com
The Bottom Line
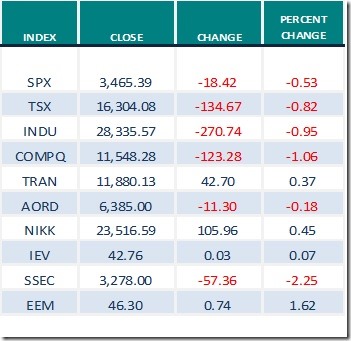
Most major equity indices around the world were flat to slightly lower last week. Greatest influences remain growing evidence of a second wave of the coronavirus (negative) and possible approval of a vaccine (positive). Look for continuation of volatile, choppy world equity markets until at least U.S. Presidential Election Day on November 3rd (and possibly longer. See observations on the Presidential Election below).
Observations
The VIX Index (better known as the Fear Index) showing volatility by the S&P 500 Index remained elevated last week.
Ditto for VXN showing volatility by the NASDAQ 100 Index
The Dow Jones Industrial Average and S&P 500 Index during U.S. Presidential Election years are following their historic trend. They move lower from early September to the third week of October followed by a move higher after the election.
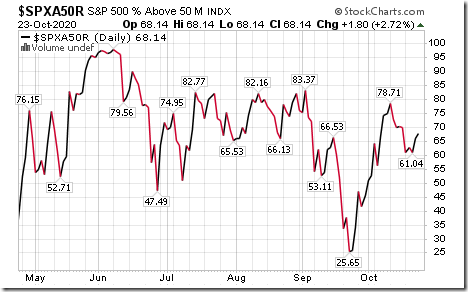
Medium term technical indicator for U.S. equity markets (e.g. Percent of S&P 500 stocks trading above their 50 day moving average) moved slightly lower last week. It remained intermediate overbought and trending down. See Barometer chart at the end of this report.
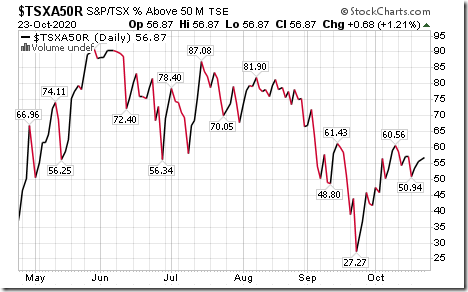
Medium term technical indicator for Canadian equity markets also moved slightly lower last week. It remained intermediate neutral. See Barometer chart at the end of this report.
Short term short term momentum indicators for U.S. markets/commodities/sectors (20 day moving averages, short term momentum indicators) were mostly unchanged last week.
Short term momentum indicators for Canadian markets/sectors showed early signs of rolling over last week from overbought levels.
Year-over-year 2020 consensus earnings and revenue declines by S&P 500 companies ebbed slightly again last west. According to www.FactSet.com, third quarter earnings are expected to fall 16.5% (versus a decline of 18.4% last week) and revenues are expected to slip 3.1% (versus previous decline of 3.3%). Fourth quarter earnings are expected to drop 11.6% (versus previous decline of 11.8%) and revenues are expected to decline 1.0% (versus 1.1% last week). Earnings for all of 2020 are expected to fall 16.7% (versus previous decline of 17.1%) and revenues are expected to decline 2.6% (versus previous decline of 2.7%).
Consensus estimates for earnings and revenues by S&P 500 companies turn positive on a year-over-year basis in the first quarter of 2021. According to www.FactSet.com earnings in the first quarter of 2021 are expected to increase 14.3% (versus previous 14.1% increase) and revenues are expected to increase 3.1%. Earnings in the second quarter are expected to increase 44.1% (versus previous increase of 44.6%) and revenues are expected to increase 13.5% (versus previous increase of 13.3%. Earnings for all of 2021 are expected to increase 24.2% (versus previous increase of 24.6%) and revenues are expected to increase 7.9% (versus previous increase of 8.0%).
Presidential Election Polls following the debate last Thursday did not change significantly implying that Biden likely will win on November 3rd or shortly thereafter. U.S. equity markets already are anticipating a Biden win. The real political battle is for control over the Senate. The Republicans currently control the Senate with a 52/48 majority. However, one third of current seats are on the ballot on November 3rd and the Republicans currently hold about 2/3 of these seats: Many are hotly contested. If majority control of the Senate flips to the Democrats, an immediate downside move by U.S. equity markets is expected.
Economic News This Week
September U.S. New Home Sales to be released at 10:00 AM EDT on Monday are expected to increase to 1.022 million units from 1.011 million units in August.
September Durable Goods Orders to be released at 8:30 AM EDT on Tuesday are expected to increase 0.7% versus a gain of 0.5% in August. Excluding Transportation Orders, September Durable Goods Orders are expected to increase 0.4% versus a gain of 0.6% in August.
Bank of Canada makes a statement on interest rates at 10:00 AM EDT on Wednesday. The Overnight Lending Rate to major banks is expected to remain unchanged at 0.25%. Press conference is held at 11:15 AM EDT.
Third quarter annualized real U.S. GDP growth to be released at 8:30 AM EDT on Thursday is expected to reach 30.8% versus a decline of 31.4% in the second quarter.
September Personal Spending to be released at 8:30 AM EDT on Friday is expected to increase 1.0% versus a gain of 1.0% in August. September Personal Income is expected to increase 0.5% versus a decline of 2.7% in August
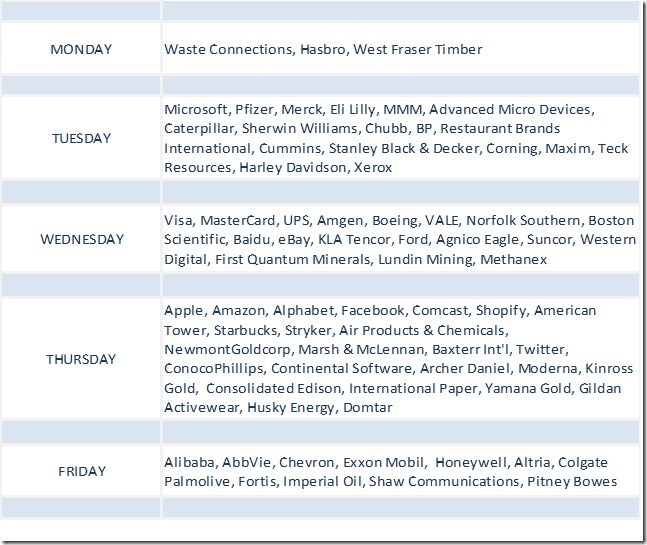
Selected Earnings News This Week
Frequency of third quarter corporate reports peaks this week: 27% of S&P 500 companies have released results to date with 84% reporting higher than consensus earnings and 80% reporting higher than consensus revenues. Despite positive quarterly results released to date, most share prices of reporting companies moved lower. Another 183 S&P 500 (including 10 Dow Jones Industrial Average companies) and 12 TSX 60 companies are scheduled to report quarterly results this week. Focus is on high tech companies reporting quarterly results on Thursday.
Trader’s Corner
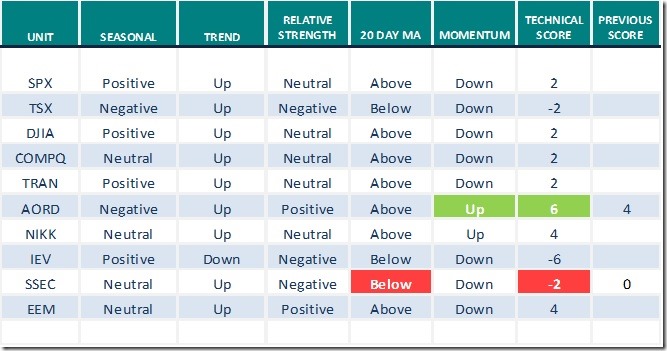
Equity Indices and Related ETFs
Daily Seasonal/Technical Equity Trends for October 23rd 2020
Green: Increase from previous day
Red: Decrease from previous day
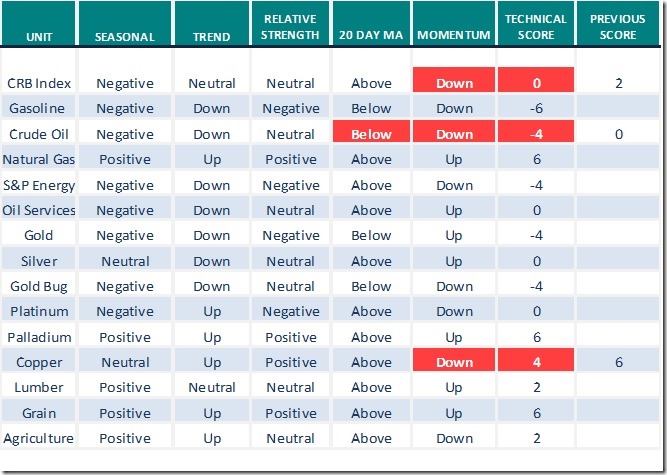
Commodities
Daily Seasonal/Technical Commodities Trends for October 23rd 2020
Green: Increase from previous day
Red: Decrease from previous day
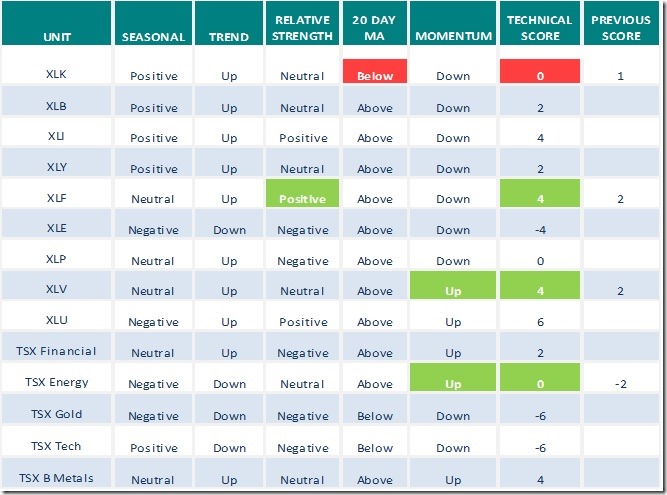
Sectors
Daily Seasonal/Technical Sector Trends for October 23rd 2020
Green: Increase from previous day
Red: Decrease from previous day
Technical Scores
Calculated as follows:
Intermediate Uptrend based on at least 20 trading days: Score 2
(Higher highs and higher lows)
Intermediate Neutral trend: Score 0
(Not up or down)
Intermediate Downtrend: Score -2
(Lower highs and lower lows)
Outperformance relative to the S&P 500 Index: Score: 2
Neutral Performance relative to the S&P 500 Index: 0
Underperformance relative to the S&P 500 Index: Score –2
Above 20 day moving average: Score 1
At 20 day moving average: Score: 0
Below 20 day moving average: –1
Up trending momentum indicators (Daily Stochastics, RSI and MACD): 1
Mixed momentum indicators: 0
Down trending momentum indicators: –1
Technical scores range from -6 to +6. Technical buy signals based on the above guidelines start when a security advances to at least 0.0, but preferably 2.0 or higher. Technical sell/short signals start when a security descends to 0, but preferably -2.0 or lower.
Long positions require maintaining a technical score of -2.0 or higher. Conversely, a short position requires maintaining a technical score of +2.0 or lower
Changes Last Week
Technical Notes for Friday October 23rd
Intel (INTC), a Dow Jones Industrial Average stock moved below intermediate support at $46.65 following release of a disappointing third quarter report.
Constellation Software (CSU), a TSX 60 stock moved below $1440.06 completing a Head & Shoulders pattern.
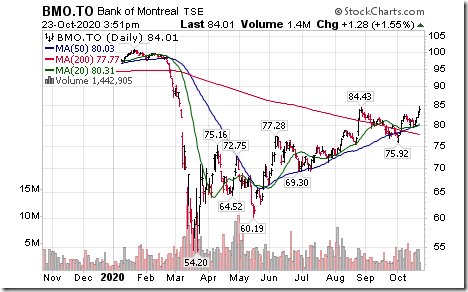
Bank of Montreal (BMO), a TSX 60 stock moved above $84.43 extending an intermediate uptrend.
S&P 500 Momentum Barometer
The Barometer gained 1.80 on Friday but dropped 2.14 last week to 68.14. It remains intermediate overbought and trending down.
TSX Momentum Barometer
The Barometer added 0.68 on Friday but slipped 0.41 last week. It remains intermediate neutral.
Disclaimer: Seasonality and technical ratings offered in this report and at
www.equityclock.com are for information only. They should not be considered as advice to purchase or to sell mentioned securities. Data offered in this report is believed to be accurate, but is not guaranteed
This post was originally publised at Vialoux's Tech Talk.


